| Start Page |
|
 |
| Start Page |
|
|
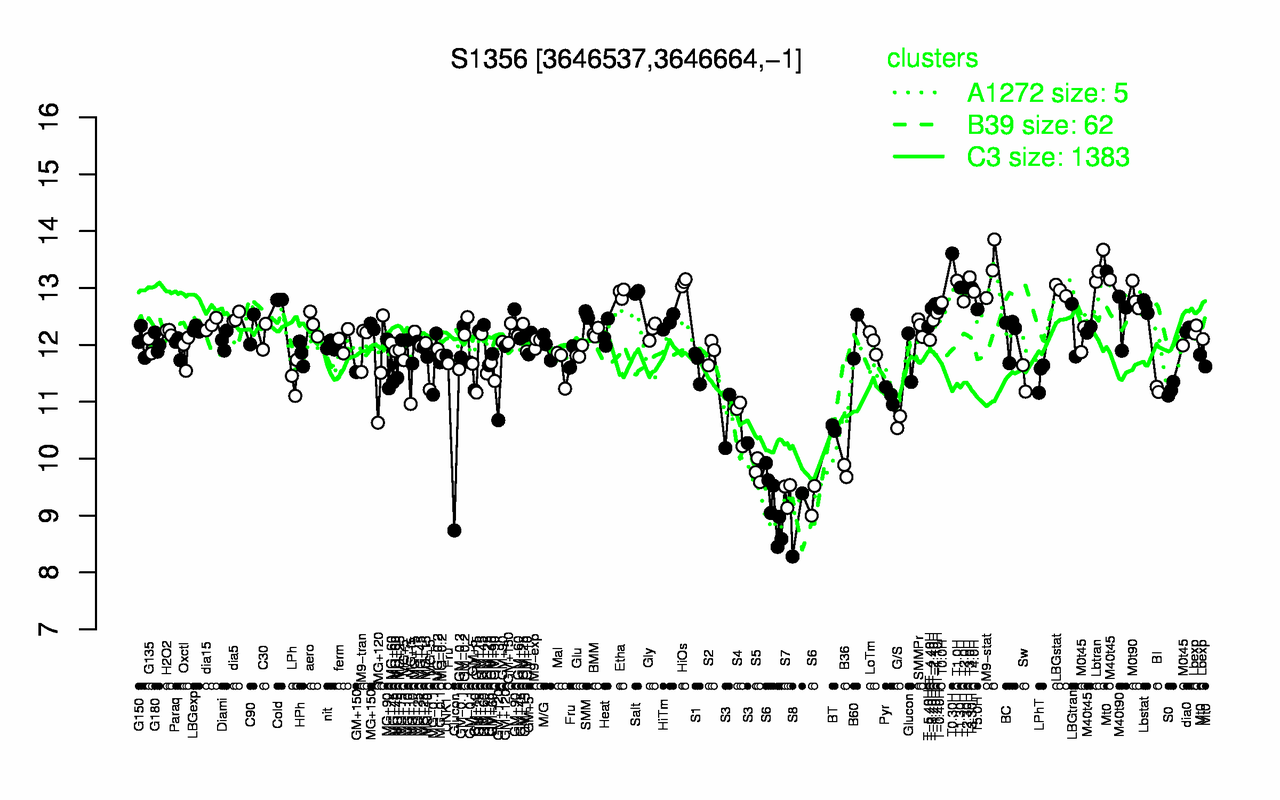
| T0.30H | Lbtran | M9-stat | T3.0H | T1.0H | HiOs | T1.30H | T2.30H | T3.30H | LBGstat |
| 13.6 | 13.4 | 13.3 | 13.2 | 13.1 | 13.1 | 13 | 13 | 13 | 13 |
| S8 | S6 | S7 | B36 | S5 | S3 | BT | G/S | S4 | Glucon |
| 8.83 | 9.18 | 9.39 | 9.78 | 9.79 | 10.5 | 10.5 | 10.6 | 10.7 | 10.8 |