| Start Page |
|
 |
| Start Page |
|
|
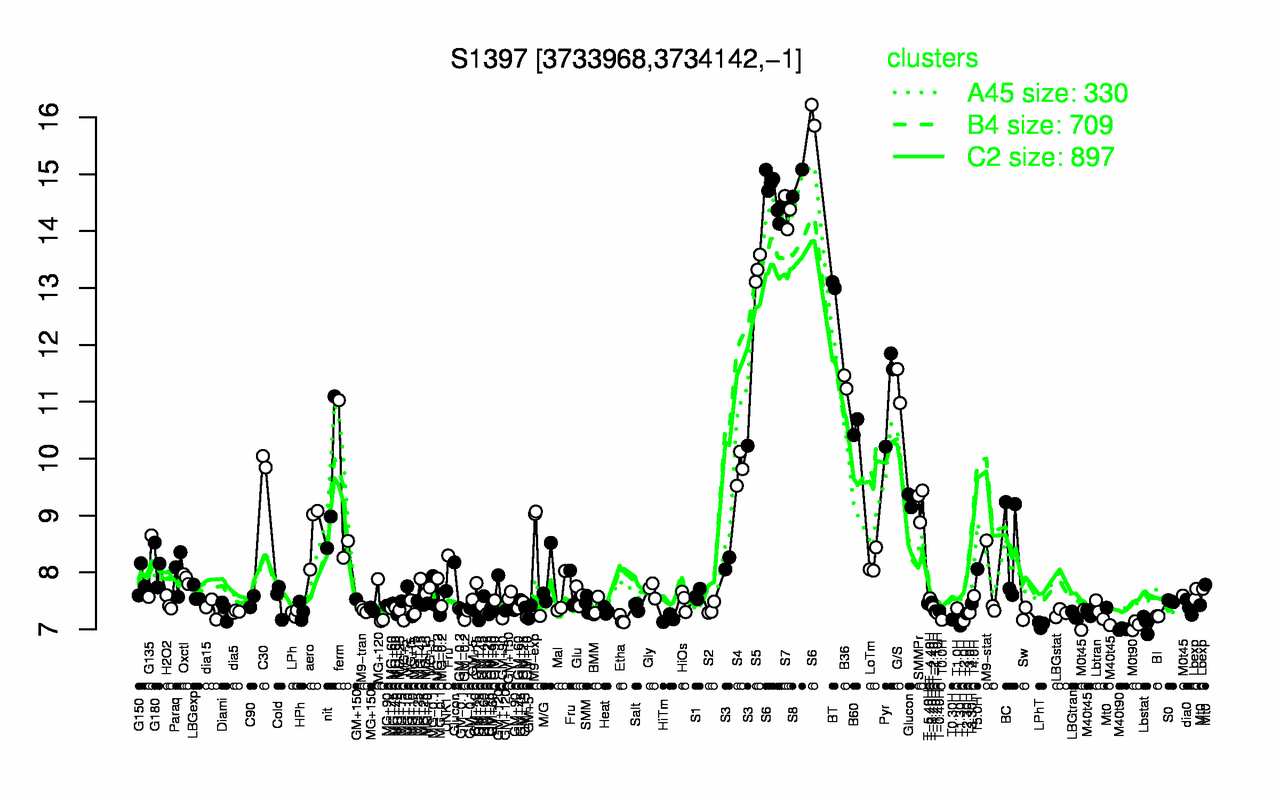
| S6 | S8 | S7 | S5 | BT | B36 | G/S | Pyr | B60 | C30 |
| 15 | 14.8 | 14.3 | 13.3 | 13.1 | 11.3 | 11.3 | 11.2 | 10.6 | 9.95 |
| M40t90 | T1.30H | M0t90 | LPhT | Lbstat | T2.0H | T0.0H | T0.30H | Etha | HiTm |
| 7 | 7.07 | 7.07 | 7.08 | 7.09 | 7.15 | 7.17 | 7.17 | 7.17 | 7.19 |