| Start Page |
|
 |
| Start Page |
|
|
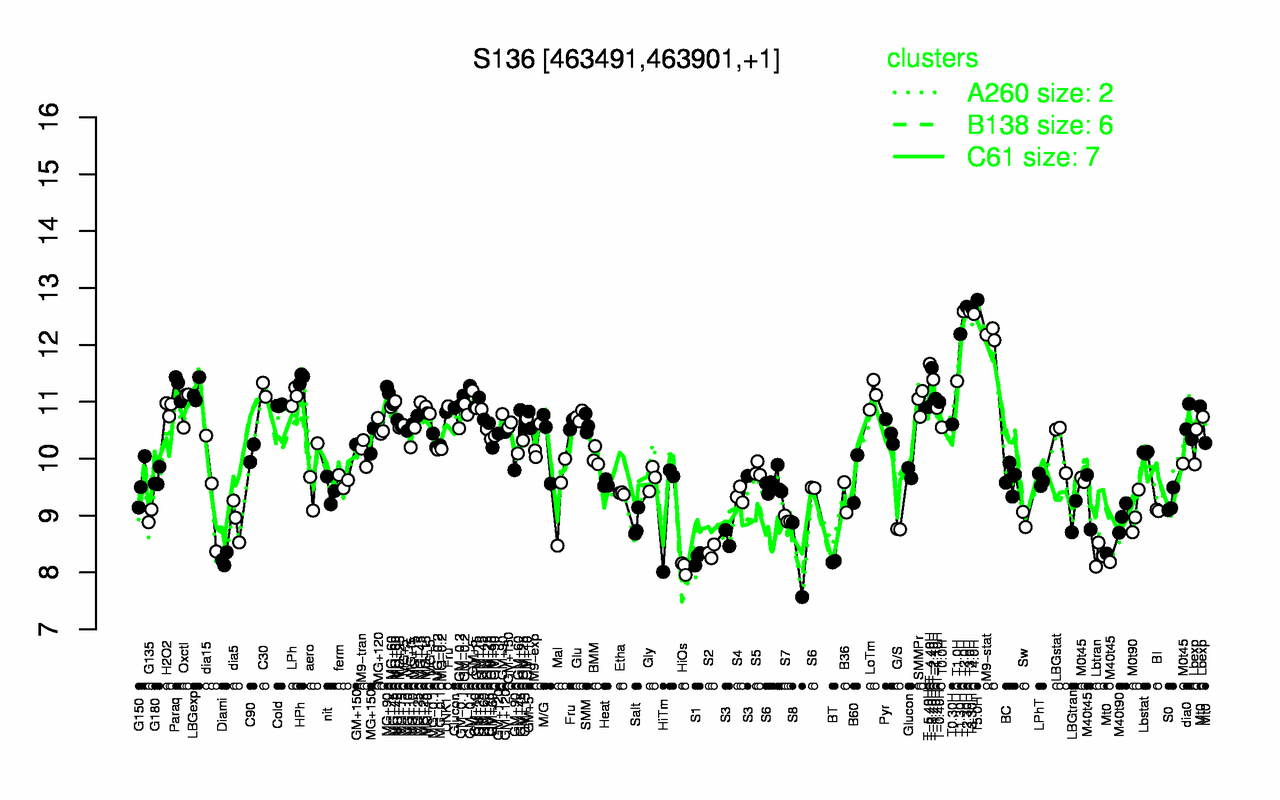
| T5.0H | T2.30H | T3.30H | T2.0H | T3.0H | T4.0H | T1.30H | M9-stat | T-4.40H | T-3.40H |
| 12.8 | 12.7 | 12.6 | 12.6 | 12.6 | 12.5 | 12.2 | 12.2 | 11.7 | 11.6 |
| HiOs | BT | S8 | Diami | S1 | Lbtran | S2 | G/S | Salt | M40t45 |
| 8.08 | 8.19 | 8.22 | 8.23 | 8.25 | 8.31 | 8.36 | 8.76 | 8.85 | 8.88 |