| Start Page |
|
 |
| Start Page |
|
|
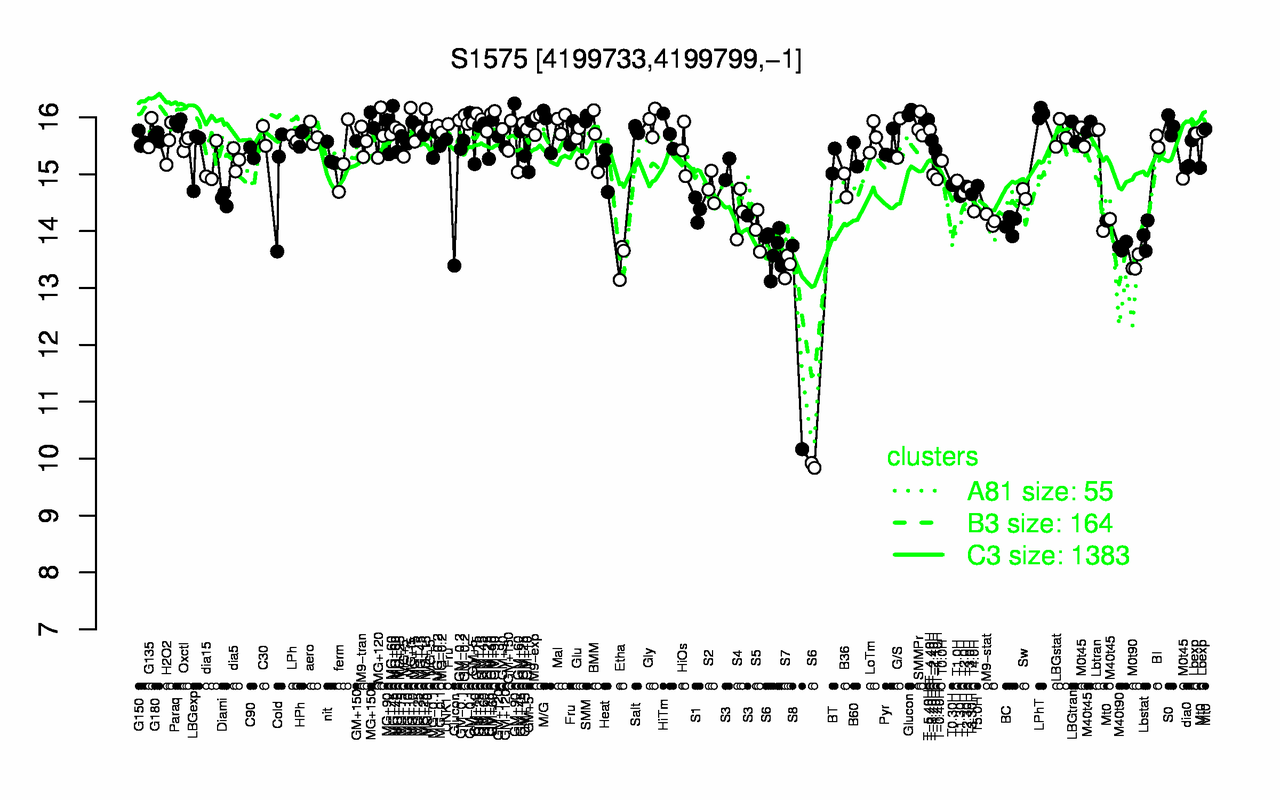
| MG+t5 | LPhT | GM+90 | SMM | T-5.40H | GM-0.2 | MG+150 | GM+45 | Gly | M9-exp |
| 16.2 | 16.1 | 16 | 16 | 16 | 16 | 15.9 | 15.9 | 15.9 | 15.9 |
| S8 | S6 | S7 | M0t90 | Etha | M40t90 | Lbstat | S5 | BC | M9-stat |
| 12 | 12.8 | 13.4 | 13.4 | 13.5 | 13.7 | 13.9 | 14 | 14.1 | 14.2 |