B. subtilis Expression Data Browser
Start Page
B. subtilis Expression Data Browser
Gene/Segment:
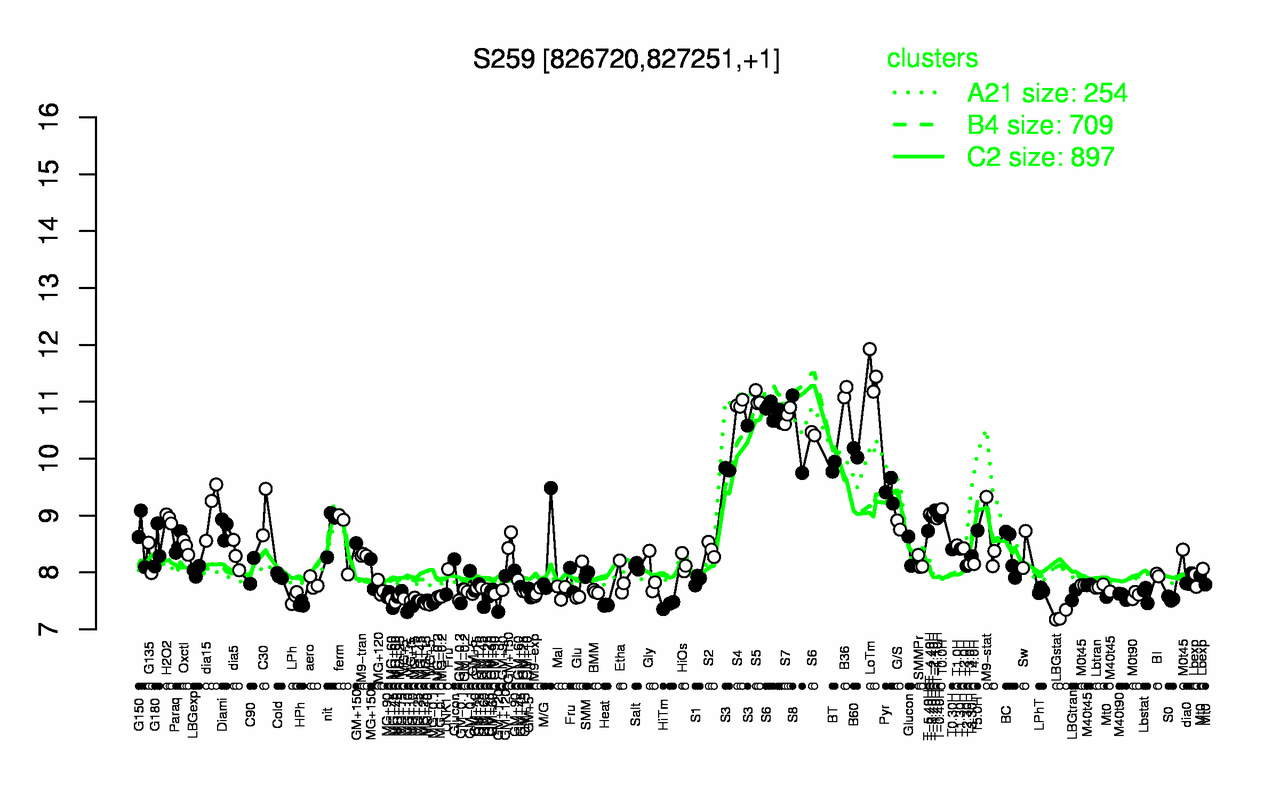
S259
Locus Tag:
new_826720_827251
Details about S259
Show/Hide
Highest Expression Conditions
LoTm
B36
S5
S4
S7
S6
S8
B60
S3
BT
11.5
11.2
11.1
11
10.8
10.7
10.4
10.1
10.1
9.86
Lowest Expression Conditions
LBGstat
MG+10
Heat
HiTm
HPh
MG+45
MG+5
MG+t5
MG+60
MG-0.1
7.23
7.41
7.42
7.43
7.45
7.48
7.49
7.5
7.5
7.52
Most Positively Correlated Segments
yfmA
S258
yizD
S1062
S111
S441
S1549
yuzC
S1183
S638
0.95
0.91
0.9
0.9
0.89
0.89
0.89
0.89
0.89
0.88
Most Negatively Correlated Segments
yddK
yugG
sigD
yqzH
yugH
sbcD
sbcC
S378
addA
penP
-0.83
-0.81
-0.81
-0.81
-0.81
-0.81
-0.8
-0.8
-0.8
-0.79
Expression Profile of Segment S259
Show/Hide
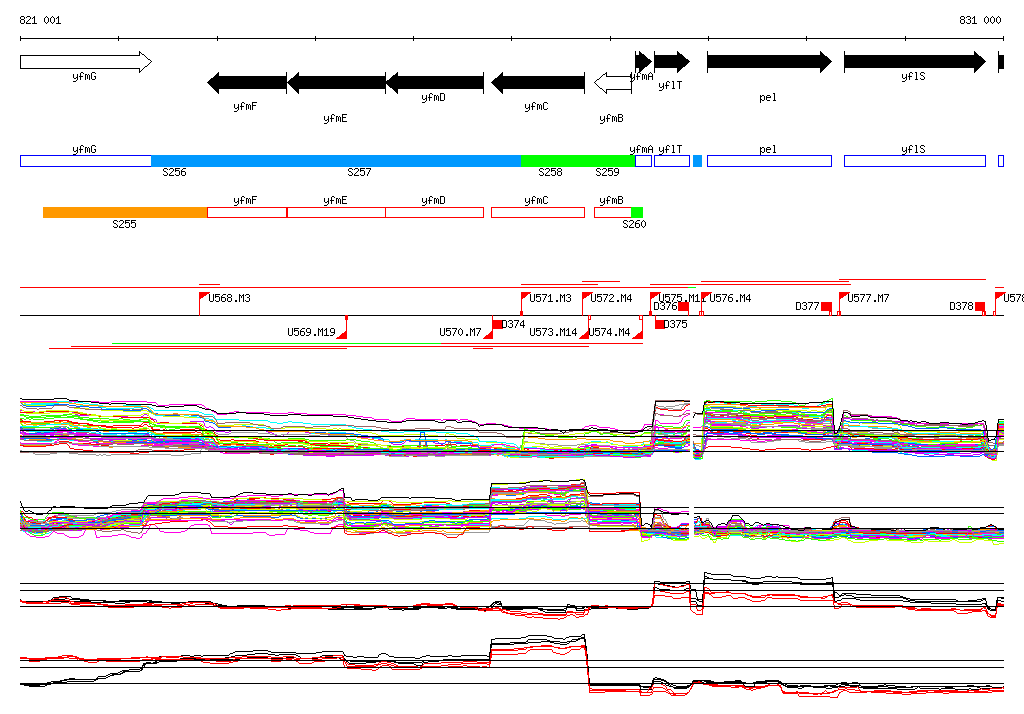
Genomic View of Gene/Segment S259
Show/Hide
(Legend)
Browse Genome Context