B. subtilis Expression Data Browser
Start Page
B. subtilis Expression Data Browser
Gene/Segment:
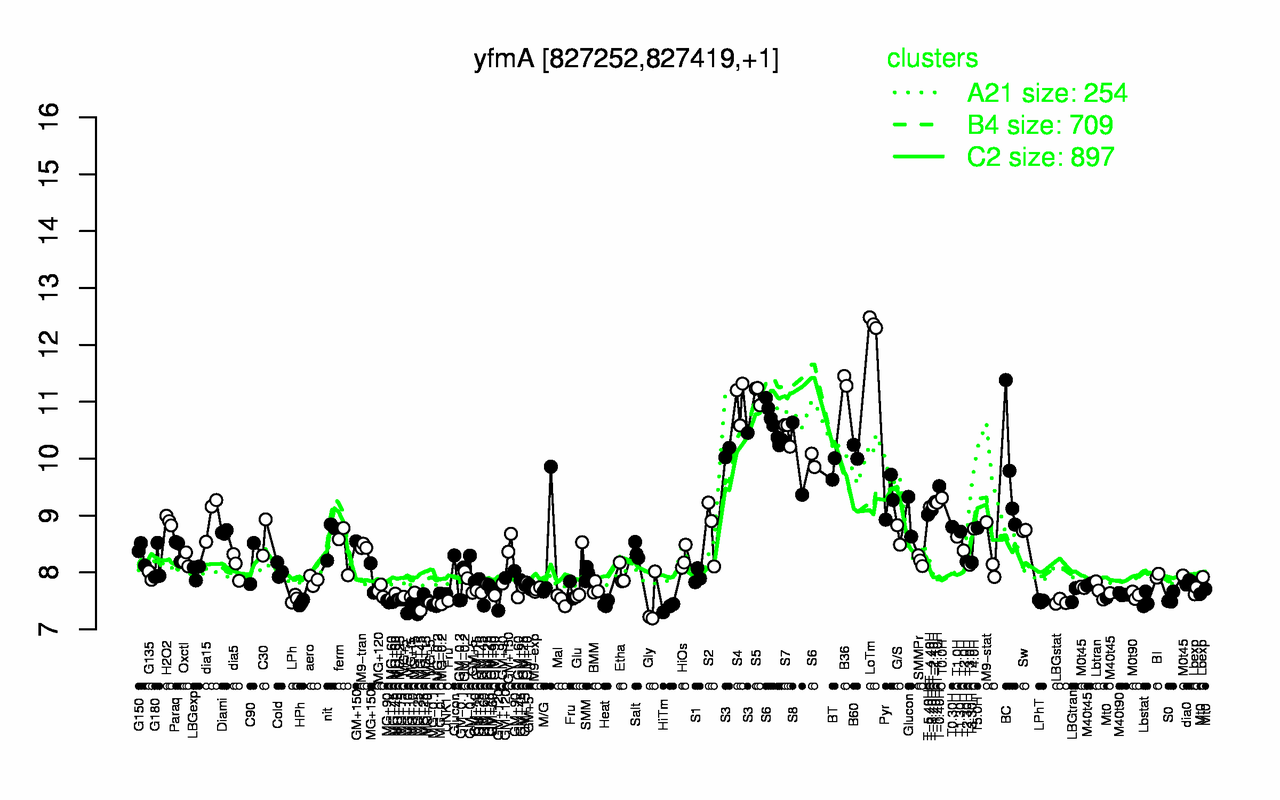
yfmA
Locus Tag:
BSU07540
Details about yfmA
Show/Hide
Highest Expression Conditions
LoTm
B36
S5
S4
S7
S6
S3
B60
S8
BT
12.4
11.4
11.1
11
10.5
10.5
10.2
10.1
10
9.82
Lowest Expression Conditions
HiTm
MG+10
MG+45
Heat
MG-0.2
MG+25
HPh
Gly
LBGstat
MG-0.1
7.38
7.42
7.44
7.45
7.45
7.47
7.47
7.48
7.48
7.49
Most Positively Correlated Segments
S259
S258
S1549
yizD
S441
S1183
S974
S337
yuzC
yjdH
0.95
0.88
0.88
0.87
0.86
0.86
0.86
0.85
0.85
0.84
Most Negatively Correlated Segments
yddK
S378
sbcD
sbcC
sigD
yqzH
cheC
cheD
kinC
addA
-0.78
-0.78
-0.78
-0.77
-0.76
-0.76
-0.76
-0.76
-0.75
-0.75
Expression Profile of Segment yfmA
Show/Hide
Annotation of Gene yfmA
Show/Hide
inference
ab initio prediction:AMIGene:2.0
codon_start
1
product
Doubtful CDS
transl_table
11
note
Evidence 6: Doubtful CDS
db_xref
GI:2633078
protein_id
CAB12583.1
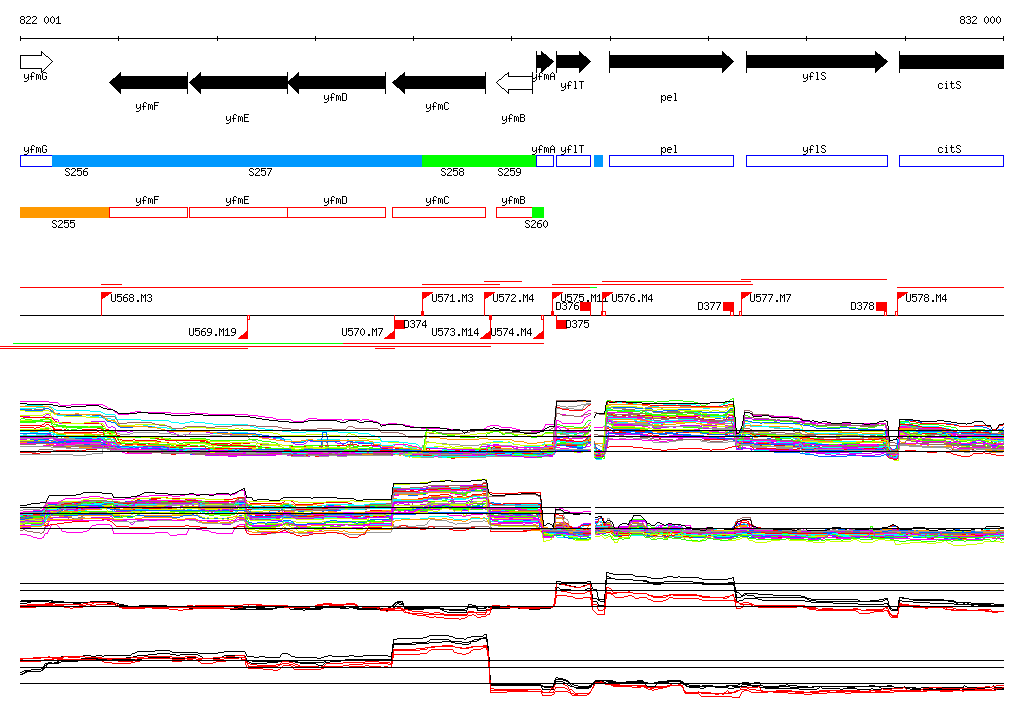
Genomic View of Gene/Segment yfmA
Show/Hide
(Legend)
Browse Genome Context