| Start Page |
|
 |
| Start Page |
|
|
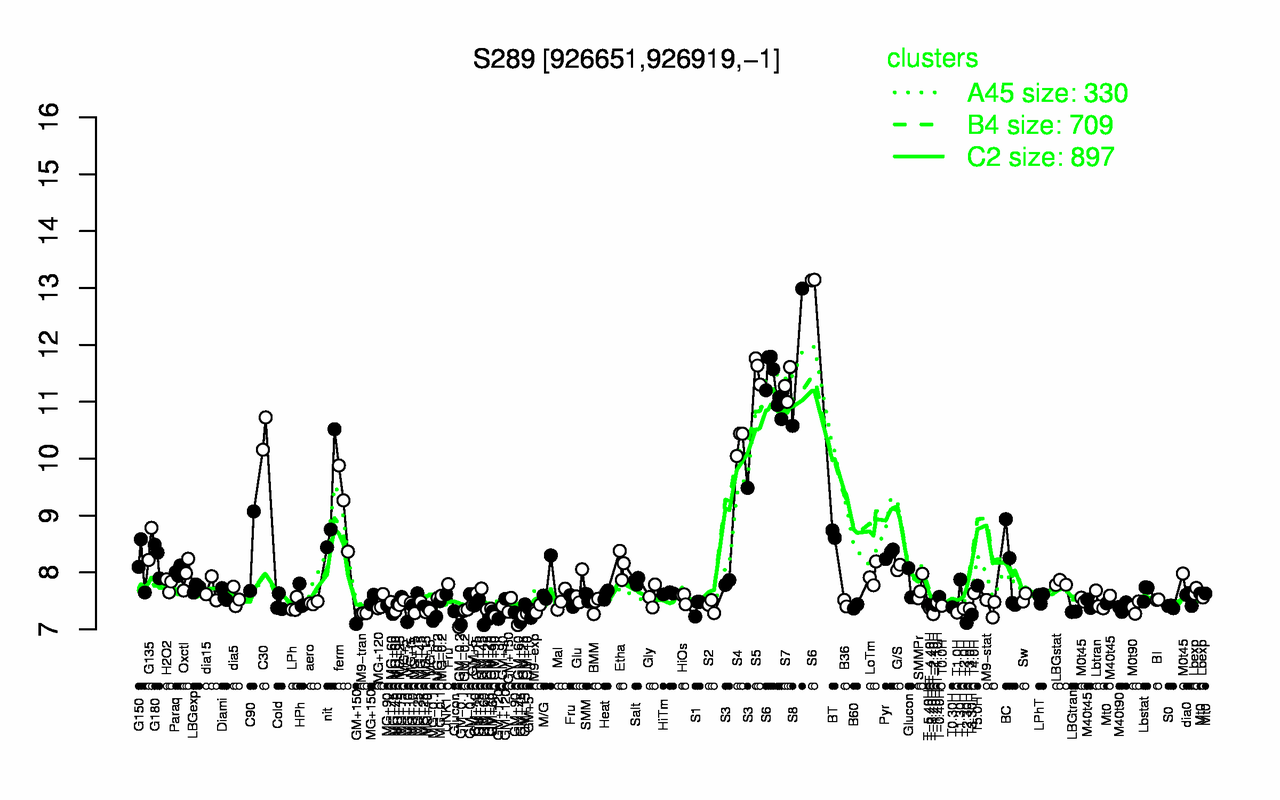
| S8 | S6 | S5 | S7 | C30 | S4 | nit | ferm | BT | G135 |
| 11.8 | 11.7 | 11.6 | 11.3 | 10.4 | 10.3 | 9.24 | 9.17 | 8.67 | 8.5 |
| T2.30H | GM+60 | GM-0.2 | T3.30H | T-2.40H | M9-tran | MG-0.1 | T1.0H | LBGtran | MG+10 |
| 7.11 | 7.16 | 7.24 | 7.26 | 7.27 | 7.28 | 7.29 | 7.29 | 7.31 | 7.31 |