| Start Page |
|
 |
| Start Page |
|
|
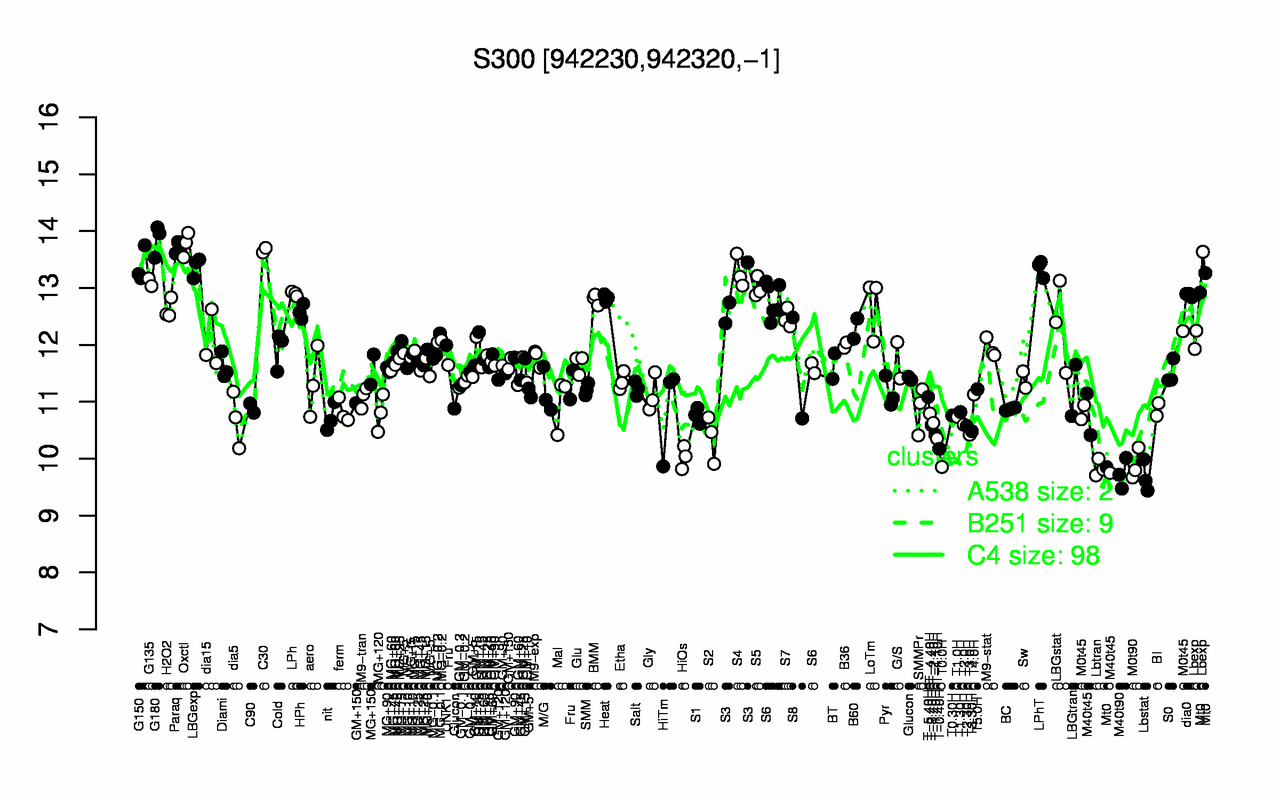
| G180 | Oxctl | Paraq | C30 | G150 | LBGexp | LPhT | S4 | G135 | S5 |
| 13.9 | 13.8 | 13.7 | 13.7 | 13.4 | 13.4 | 13.3 | 13.3 | 13.1 | 13 |
| Lbstat | M40t90 | Lbtran | T0.0H | M0t90 | HiOs | T-0.40H | T-1.10H | S2 | T-1.40H |
| 9.68 | 9.73 | 9.84 | 9.85 | 9.89 | 10 | 10.2 | 10.4 | 10.4 | 10.4 |