| Start Page |
|
 |
| Start Page |
|
|
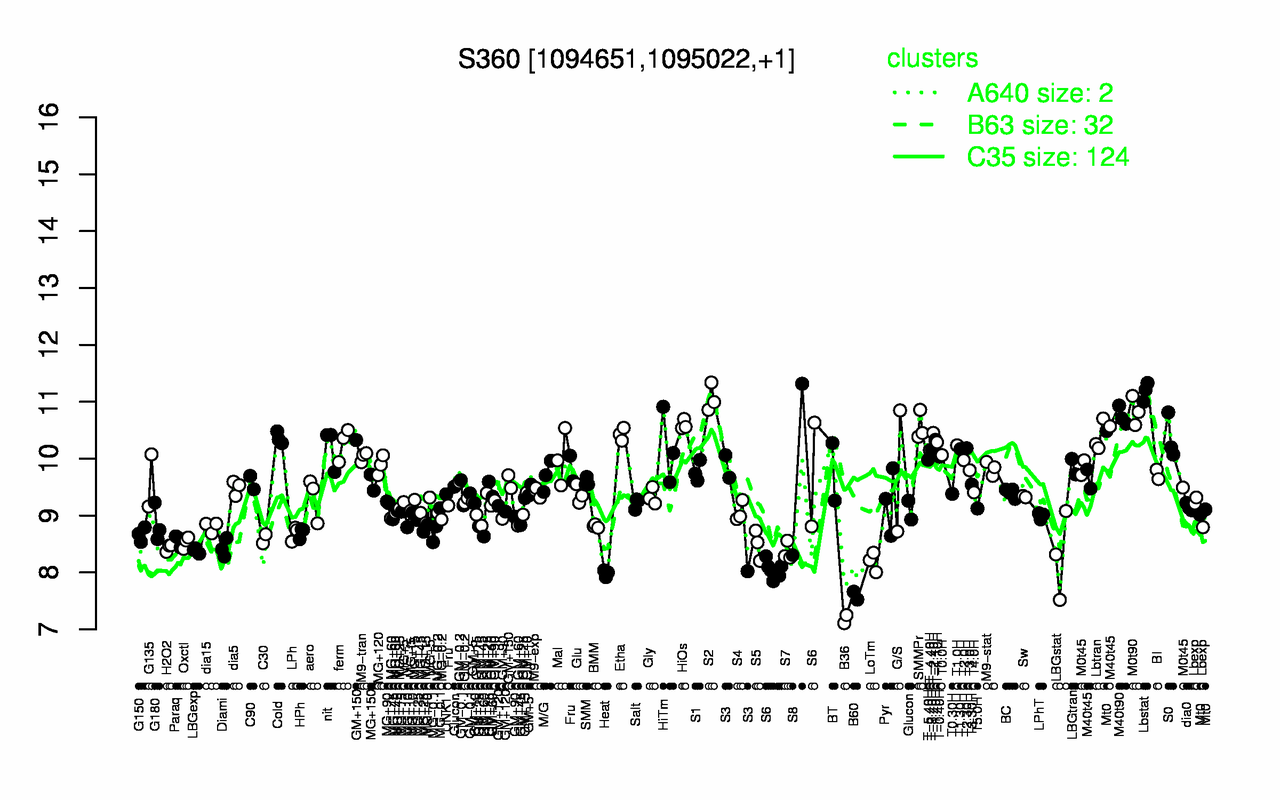
| Lbstat | S2 | M0t90 | M40t90 | HiOs | SMMPr | T-2.40H | Etha | Lbtran | Cold |
| 11.2 | 11.1 | 10.8 | 10.8 | 10.6 | 10.6 | 10.5 | 10.4 | 10.4 | 10.4 |
| B36 | B60 | Heat | LoTm | LBGstat | S7 | LBGexp | S6 | Diami | H2O2 |
| 7.18 | 7.59 | 7.98 | 8.19 | 8.3 | 8.37 | 8.38 | 8.42 | 8.43 | 8.44 |