B. subtilis Expression Data Browser
Start Page
B. subtilis Expression Data Browser
Gene/Segment:
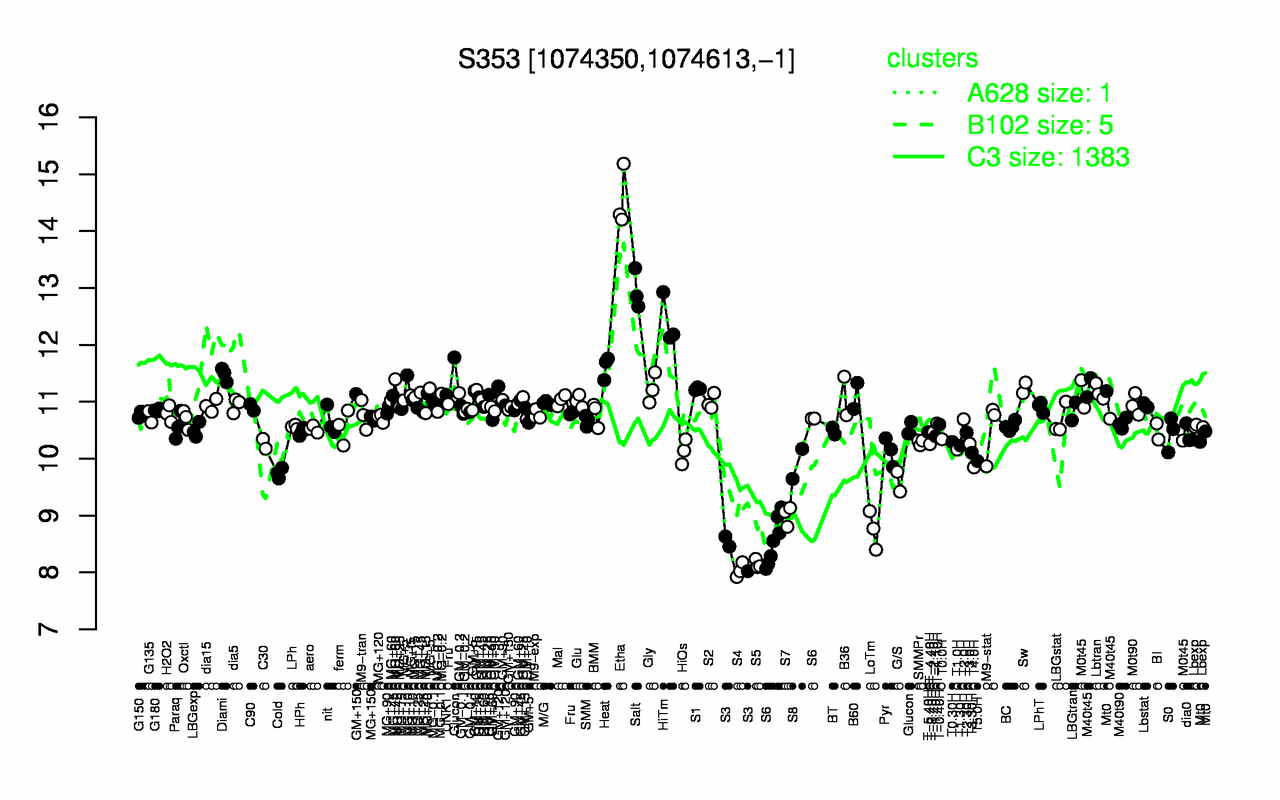
S353
Locus Tag:
new_1074350_1074613_c
Details about S353
Show/Hide
Highest Expression Conditions
Etha
Salt
HiTm
Heat
Diami
Sw
Gly
S1
MG+10
MG+60
14.6
13
12.4
11.6
11.5
11.2
11.2
11.2
11.2
11.2
Lowest Expression Conditions
S4
S5
S3
LoTm
S7
S6
G/S
Cold
T4.0H
S8
8.04
8.15
8.37
8.75
9
9.03
9.6
9.75
9.85
9.91
Most Positively Correlated Segments
yxxB
gtaB
yisP
alsR
holB
ygxA
yceH
yceG
S389
menE
0.76
0.73
0.73
0.73
0.72
0.72
0.71
0.7
0.7
0.7
Most Negatively Correlated Segments
ywcB
S373
S896
ymaF
S705
yqfC
yisN
lplD
ypjB
yesJ
-0.74
-0.74
-0.73
-0.72
-0.72
-0.71
-0.71
-0.71
-0.7
-0.7
Expression Profile of Segment S353
Show/Hide
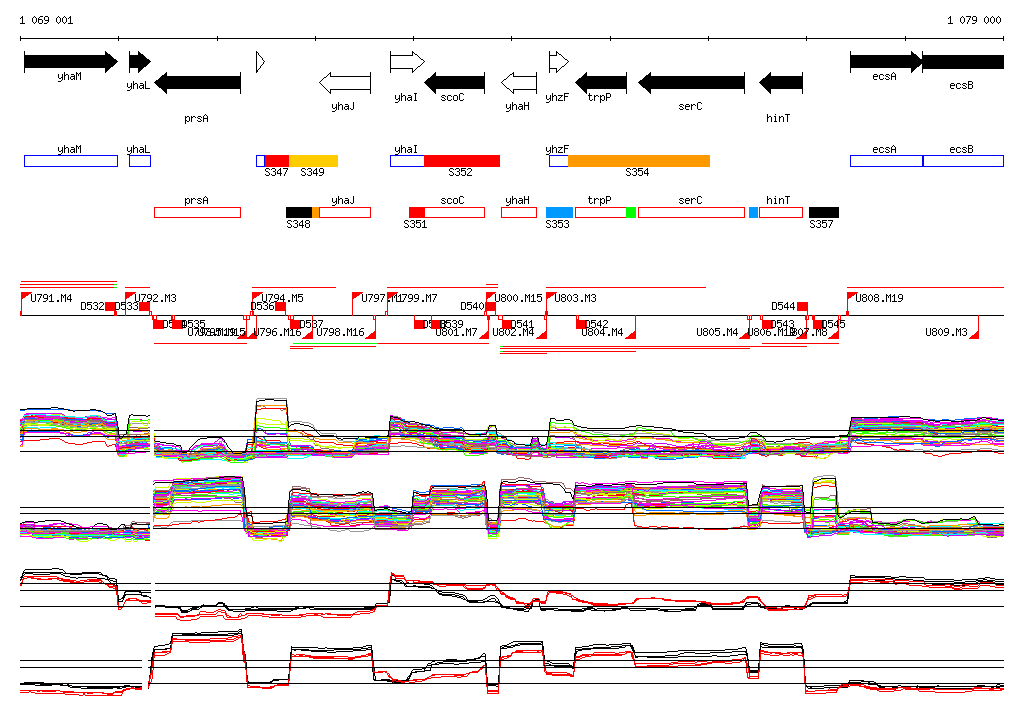
Genomic View of Gene/Segment S353
Show/Hide
(Legend)
Browse Genome Context