| Start Page |
|
 |
| Start Page |
|
|
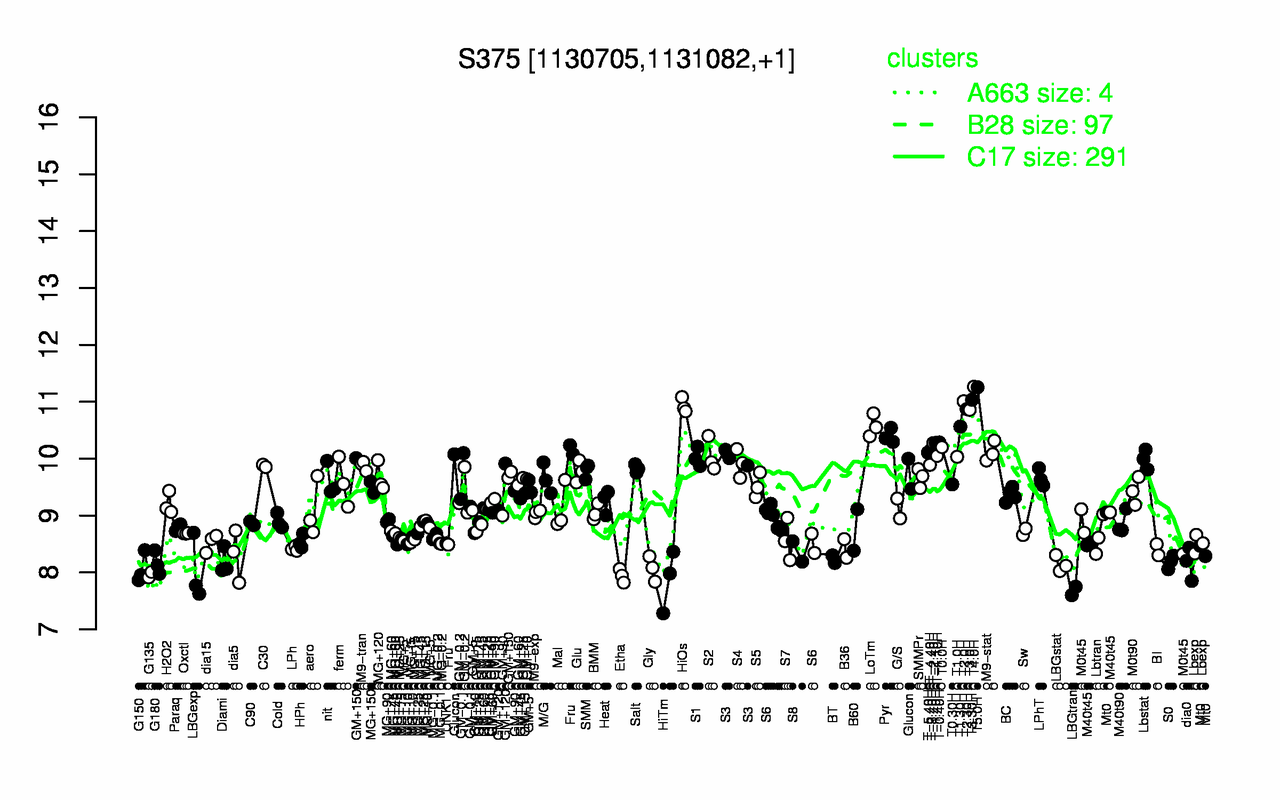
| T4.0H | T5.0H | T3.30H | T2.0H | HiOs | T2.30H | T3.0H | LoTm | T1.30H | Pyr |
| 11.3 | 11.3 | 11 | 11 | 10.9 | 10.9 | 10.9 | 10.6 | 10.6 | 10.4 |
| LBGtran | HiTm | Etha | G135 | LBGexp | Gly | G150 | LBGstat | G180 | dia0 |
| 7.67 | 7.88 | 7.94 | 7.96 | 8.03 | 8.07 | 8.07 | 8.15 | 8.16 | 8.16 |