B. subtilis Expression Data Browser
Start Page
B. subtilis Expression Data Browser
Gene/Segment:
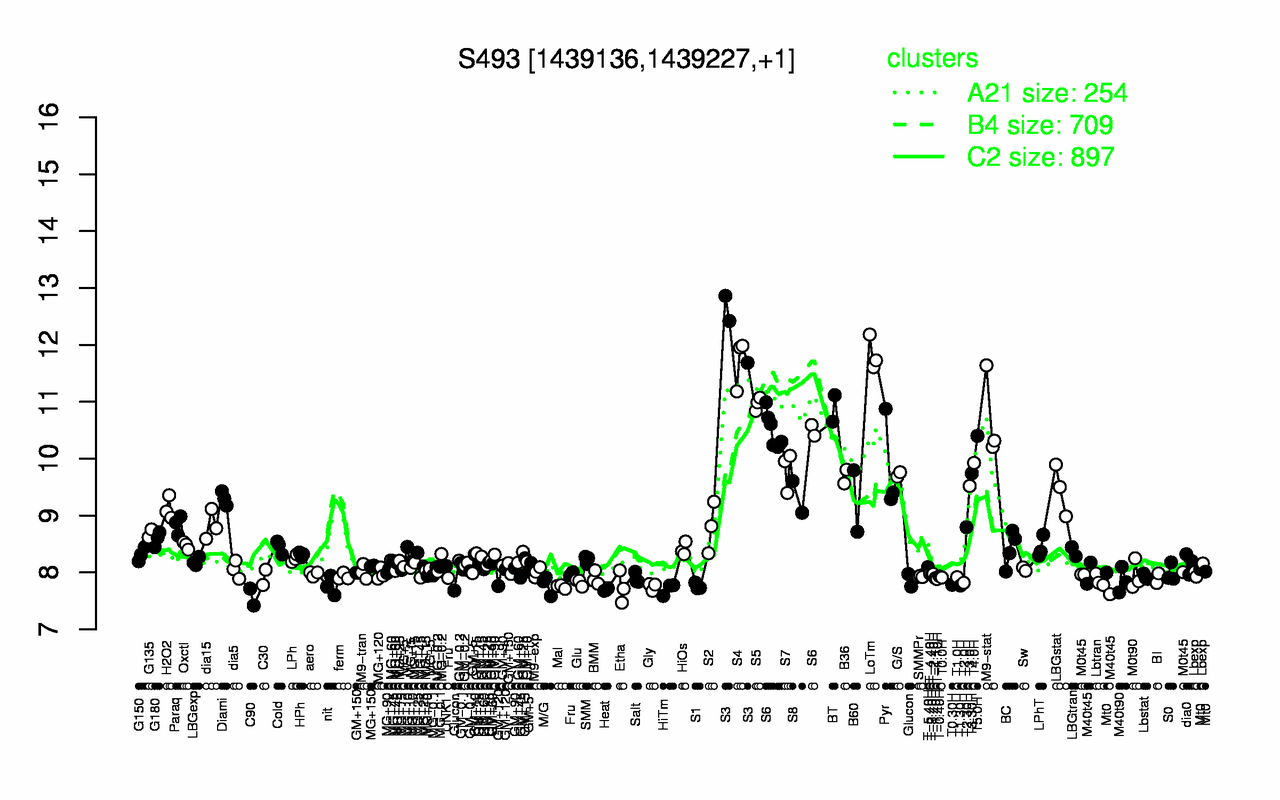
S493
Locus Tag:
new_1439136_1439227
Details about S493
Show/Hide
Highest Expression Conditions
S3
LoTm
S4
S5
BT
M9-stat
S6
T5.0H
T4.0H
Pyr
12.3
11.8
11.7
11
10.9
10.7
10.5
10.4
9.92
9.86
Lowest Expression Conditions
C90
Heat
HiTm
Etha
Mal
Gly
S1
nit
T1.30H
M/G
7.57
7.7
7.71
7.74
7.75
7.75
7.76
7.76
7.77
7.78
Most Positively Correlated Segments
ykvI
spoVD
spoIVFA
dacB
spmA
spoIVFB
ykvU
spmB
yloB
ylbJ
0.96
0.95
0.95
0.95
0.94
0.94
0.94
0.94
0.93
0.93
Most Negatively Correlated Segments
S1129
yceH
sigD
yceG
cheC
cheD
yugH
cheW
flhA
sbcD
-0.78
-0.78
-0.77
-0.77
-0.76
-0.76
-0.75
-0.75
-0.74
-0.74
Expression Profile of Segment S493
Show/Hide
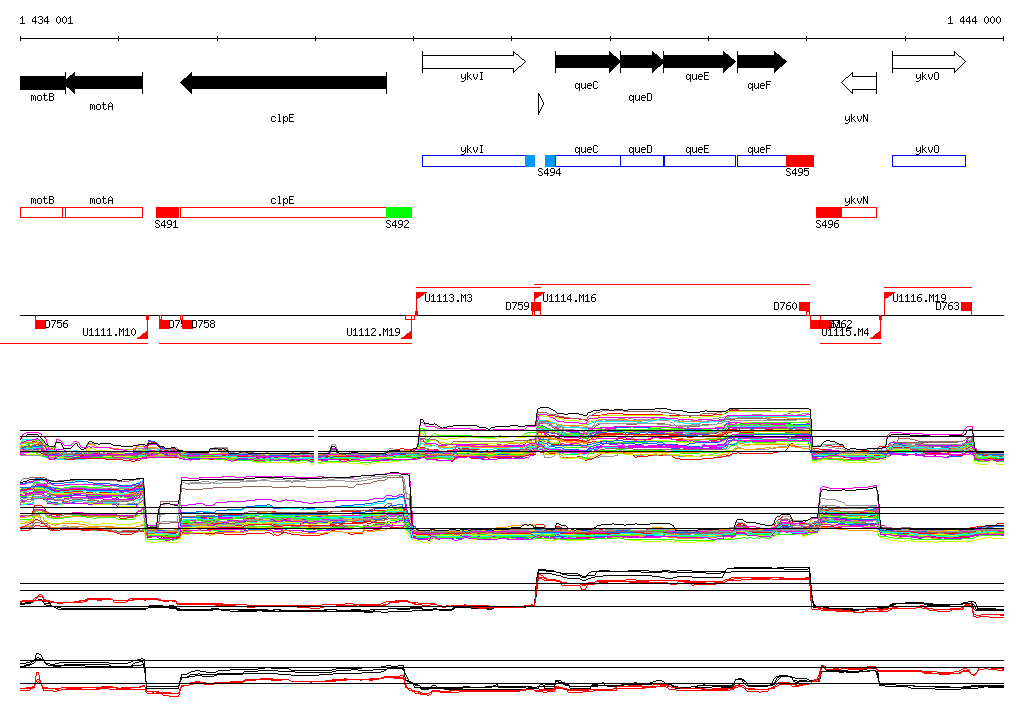
Genomic View of Gene/Segment S493
Show/Hide
(Legend)
Browse Genome Context