| Start Page |
|
 |
| Start Page |
|
|
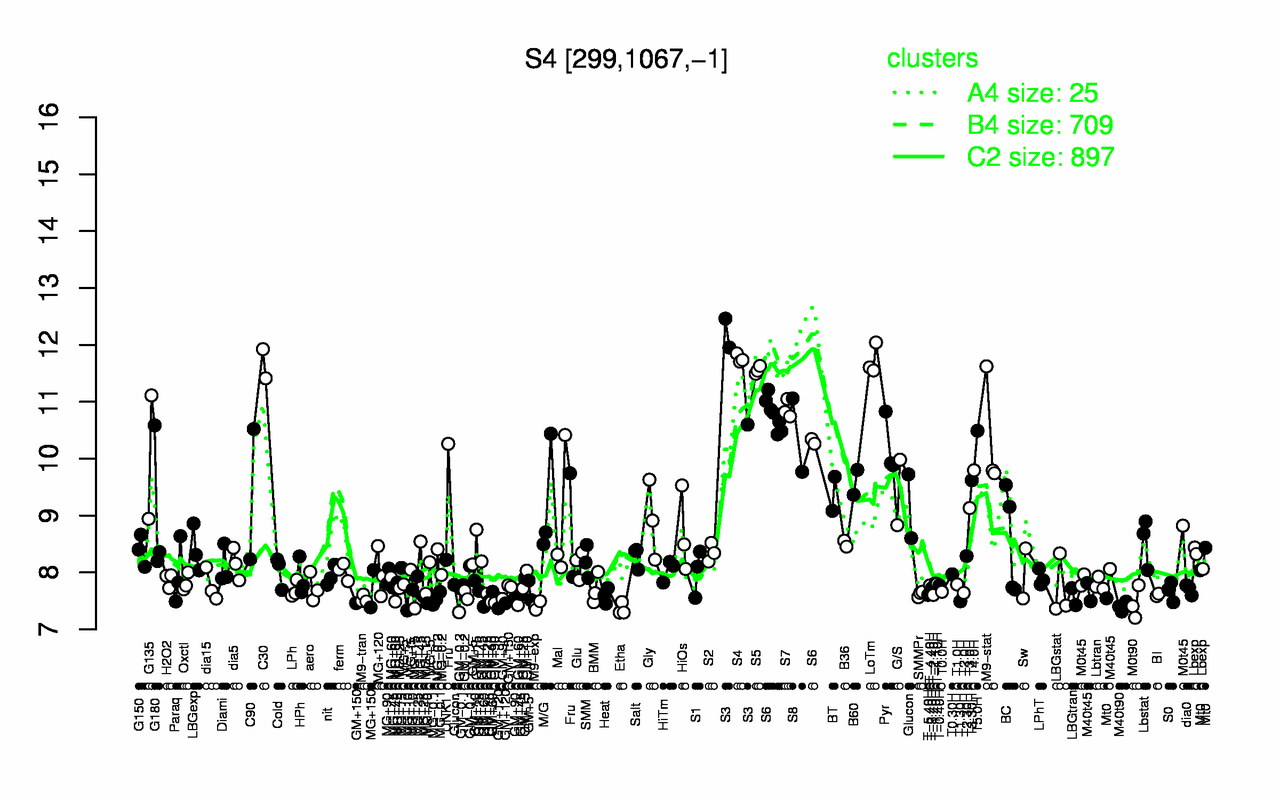
| S4 | LoTm | S3 | C30 | S5 | S7 | S6 | T5.0H | S8 | M9-stat |
| 11.8 | 11.7 | 11.7 | 11.7 | 11.6 | 10.9 | 10.7 | 10.5 | 10.4 | 10.4 |
| Etha | M40t90 | M9-exp | GM+120 | M0t90 | T1.30H | GM+60 | MG+10 | GM-0.2 | GM+90 |
| 7.36 | 7.4 | 7.41 | 7.41 | 7.46 | 7.49 | 7.49 | 7.5 | 7.5 | 7.51 |