| Start Page |
|
 |
| Start Page |
|
|
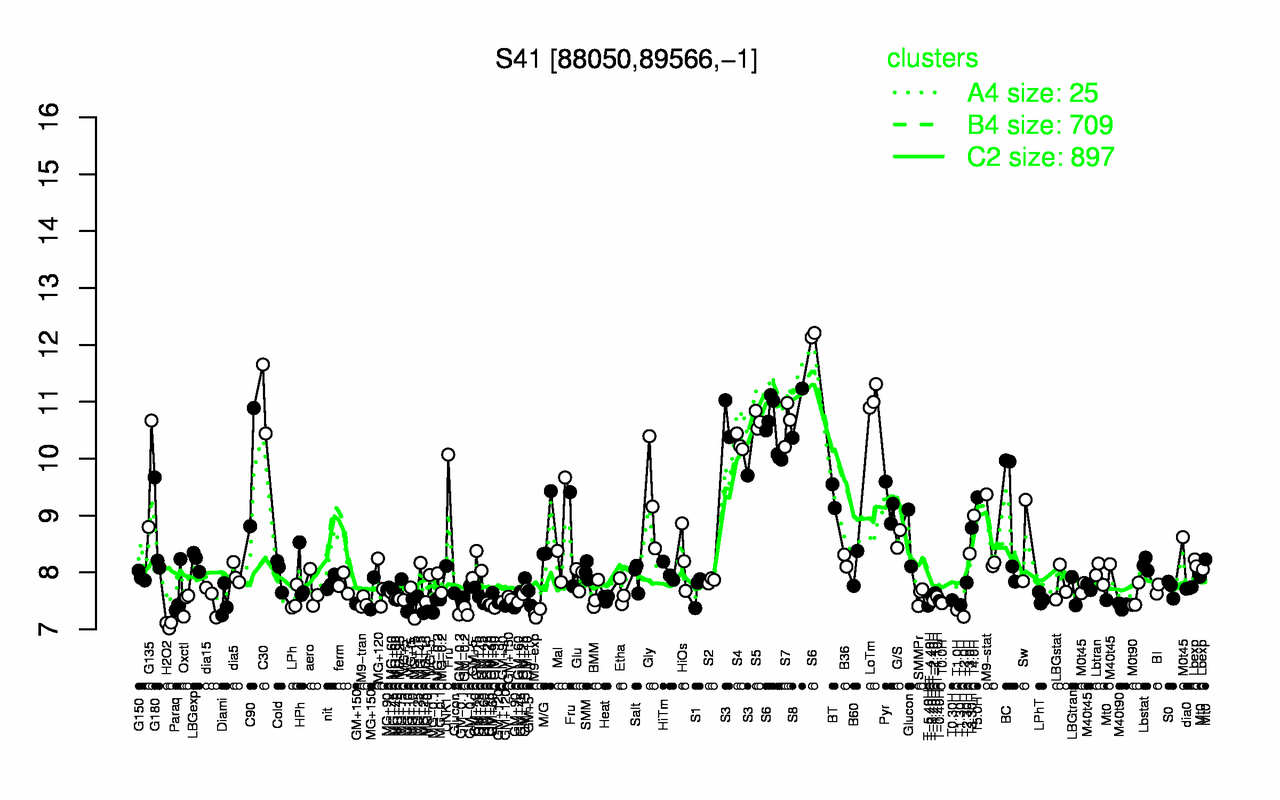
| LoTm | C30 | S6 | S8 | S5 | S7 | S3 | S4 | C90 | G135 |
| 11.1 | 11 | 10.9 | 10.8 | 10.7 | 10.6 | 10.4 | 10.3 | 9.85 | 9.73 |
| H2O2 | T2.0H | M9-exp | GM-0.2 | T1.0H | MG+10 | M40t90 | GM+90 | T-5.40H | T1.30H |
| 7.08 | 7.22 | 7.28 | 7.3 | 7.34 | 7.39 | 7.41 | 7.42 | 7.42 | 7.43 |