| Start Page |
|
 |
| Start Page |
|
|
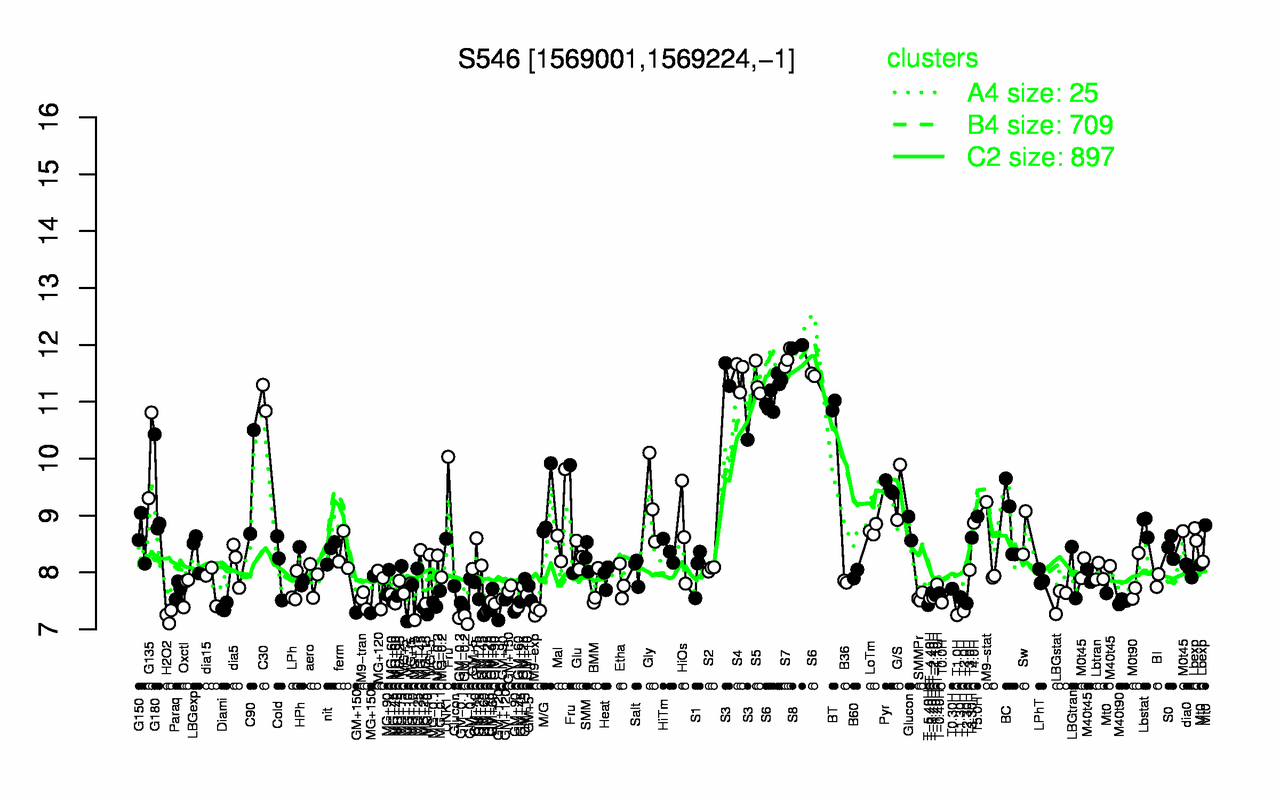
| S8 | S7 | S4 | S5 | S6 | S3 | C30 | BT | G135 | C90 |
| 12 | 11.8 | 11.5 | 11.4 | 11.2 | 11.1 | 11.1 | 10.9 | 10.1 | 9.59 |
| GM-0.2 | H2O2 | T1.0H | M9-exp | T2.0H | GM+120 | Diami | MG+10 | GM+90 | T-5.40H |
| 7.18 | 7.23 | 7.25 | 7.31 | 7.32 | 7.34 | 7.39 | 7.39 | 7.43 | 7.43 |