| Start Page |
|
 |
| Start Page |
|
|
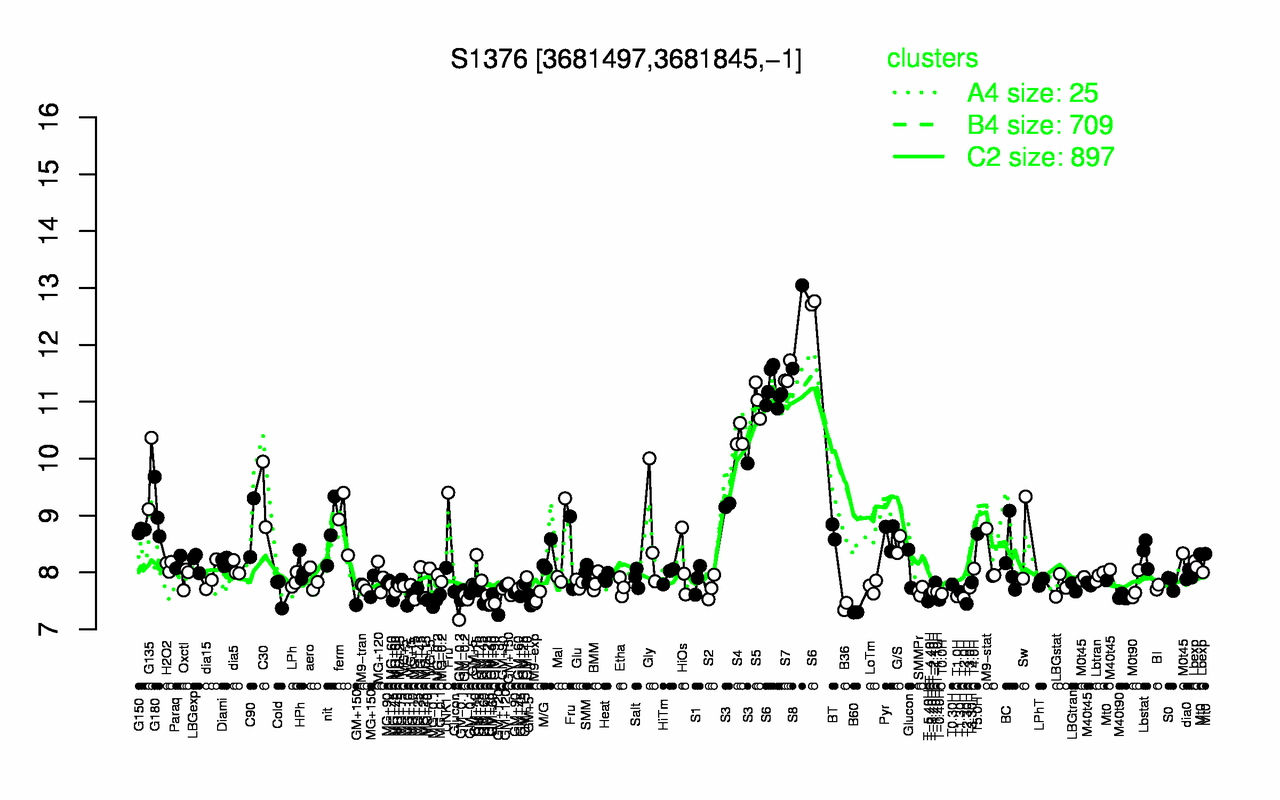
| S8 | S6 | S7 | S5 | S4 | G135 | S3 | C30 | G180 | ferm |
| 12.3 | 11.5 | 11.5 | 11 | 10.4 | 9.74 | 9.43 | 9.37 | 9.09 | 8.88 |
| B60 | B36 | GM-0.2 | T2.30H | T-5.40H | MG-0.1 | GM+120 | MG+10 | T-0.40H | M9-exp |
| 7.3 | 7.4 | 7.43 | 7.45 | 7.49 | 7.51 | 7.51 | 7.52 | 7.52 | 7.54 |