| Start Page |
|
 |
| Start Page |
|
|
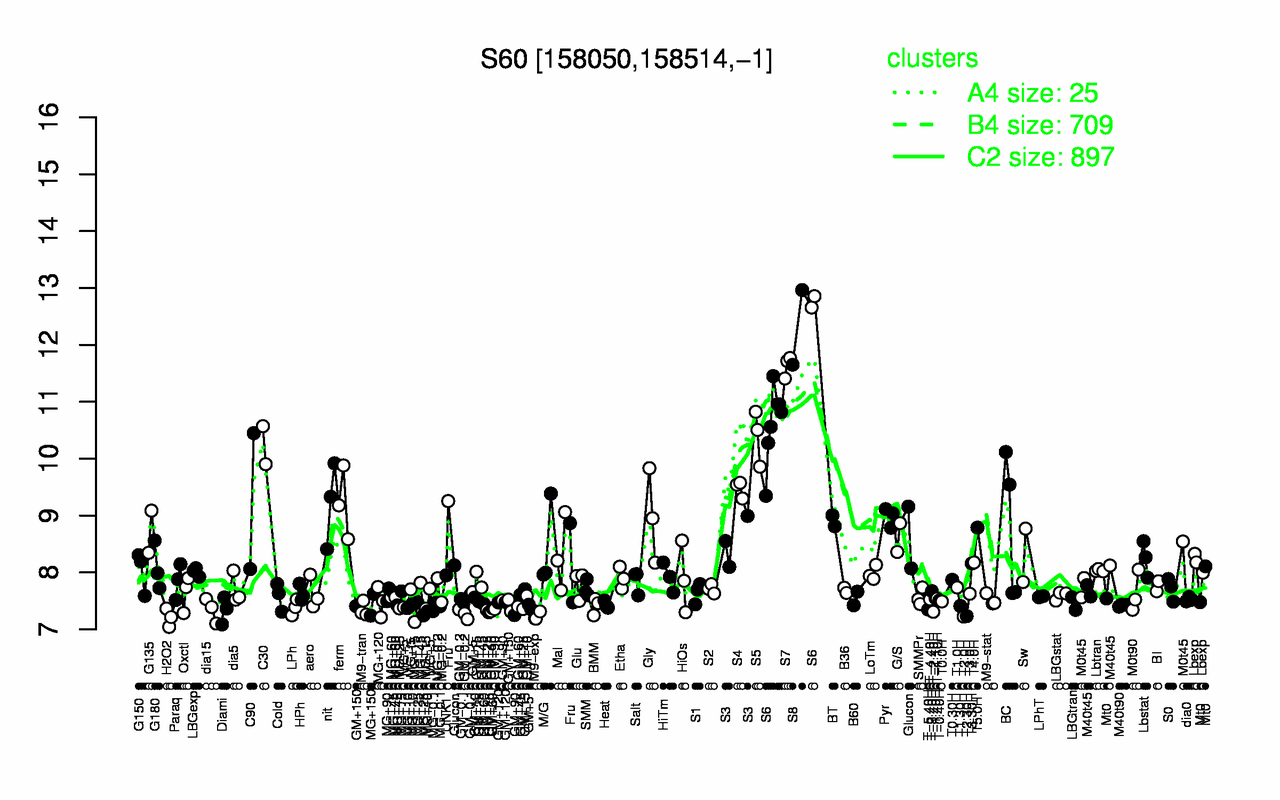
| S8 | S7 | S6 | S5 | C30 | S4 | C90 | nit | ferm | Gly |
| 12.3 | 11.6 | 11.1 | 10.4 | 10.2 | 9.47 | 9.25 | 9.22 | 9.21 | 8.99 |
| H2O2 | T2.0H | M9-exp | T2.30H | GM-0.2 | T-2.40H | Diami | dia15 | T-5.40H | M9-tran |
| 7.21 | 7.22 | 7.23 | 7.23 | 7.27 | 7.31 | 7.34 | 7.34 | 7.35 | 7.35 |