| Start Page |
|
 |
| Start Page |
|
|
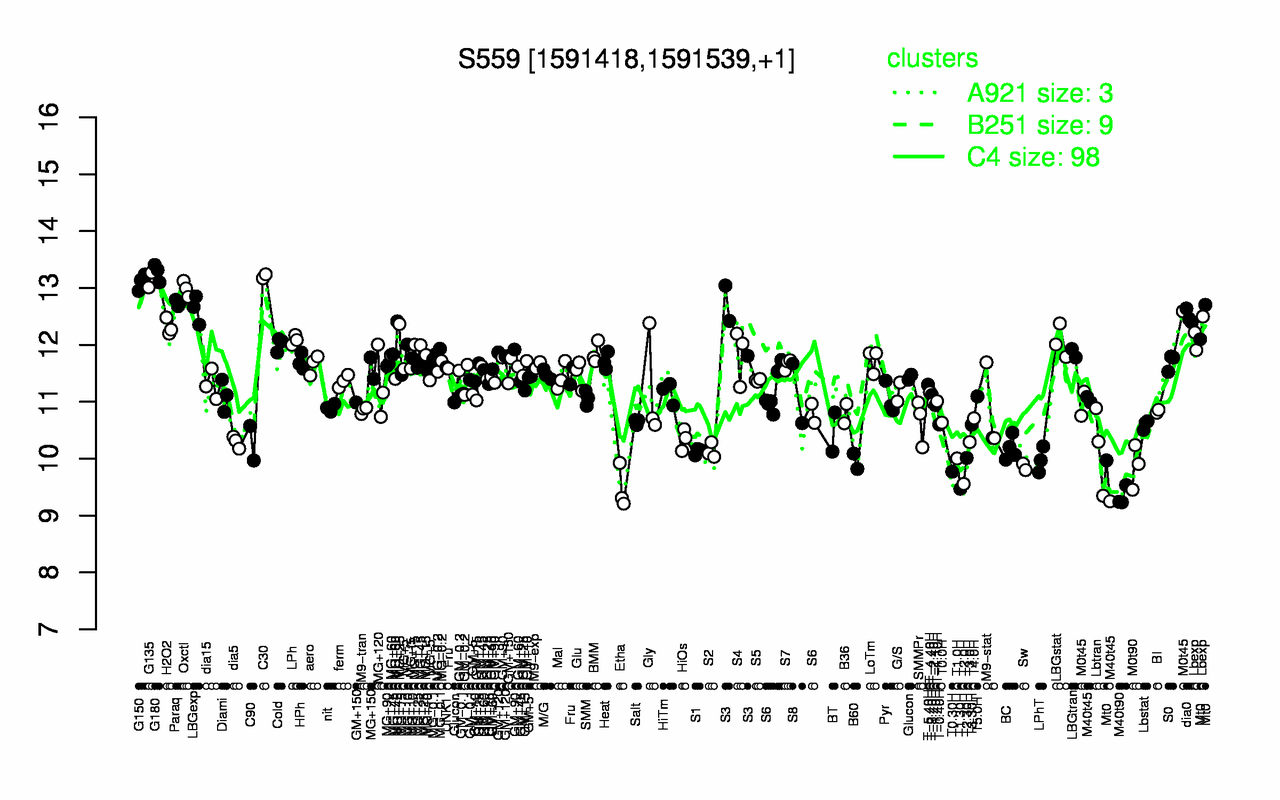
| G180 | C30 | G135 | G150 | Oxctl | Paraq | LBGexp | dia0 | S3 | H2O2 |
| 13.3 | 13.2 | 13.1 | 13.1 | 13 | 12.7 | 12.6 | 12.5 | 12.4 | 12.3 |
| M40t90 | T1.30H | Etha | T2.0H | T0.30H | Sw | M0t90 | B60 | LPhT | T1.0H |
| 9.34 | 9.47 | 9.48 | 9.56 | 9.77 | 9.86 | 9.87 | 9.95 | 9.98 | 10 |