B. subtilis Expression Data Browser
Details about spoVE Show/Hide
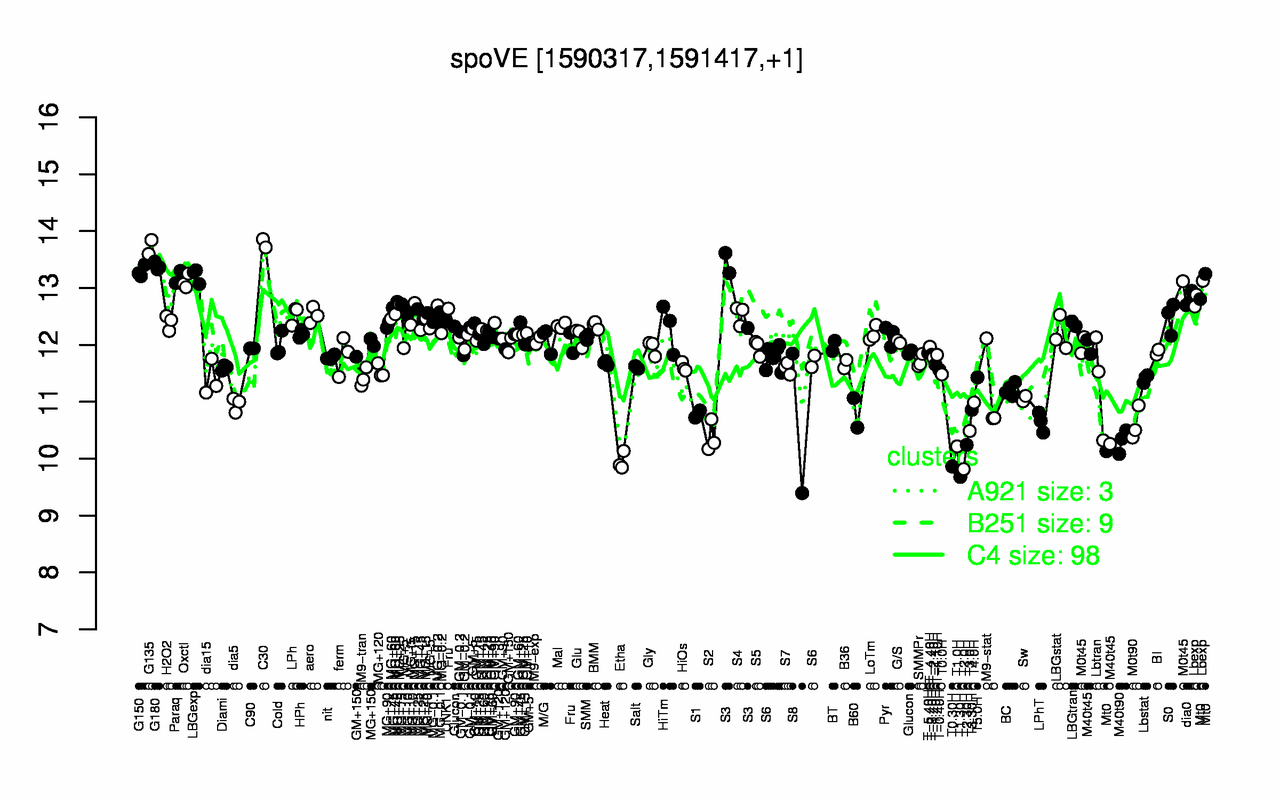
Highest Expression Conditions
C30 G135 G180 G150 LBGexp Paraq Oxctl S3 Lbexp dia0
13.8 13.7 13.4 13.3 13.2 13.2 13.1 13.1 12.9 12.8
Lowest Expression Conditions
T1.30H T2.0H T0.30H Etha T1.0H T2.30H M40t90 S2 T3.0H M0t90
9.68 9.82 9.86 9.95 10.2 10.2 10.3 10.4 10.5 10.6
Most Positively Correlated Segments
S559 murD mraY murG infB S558 apt ywqA engA ybxA
0.89 0.88 0.88 0.87 0.79 0.79 0.77 0.76 0.76 0.75
Most Negatively Correlated Segments
ylbP ypiB phrG yisT yjcG S722 yddJ ylbA yjcH yncM
-0.75 -0.73 -0.68 -0.67 -0.66 -0.65 -0.65 -0.64 -0.64 -0.64
Expression Profile of Segment spoVE Show/Hide
Annotation of Gene spoVE Show/Hide
function
16.13: Shape
inference
ab initio prediction:AMIGene:2.0
codon_start
1
product
factor for spore cortex peptidoglycan synthesis (stage V sporulation)
transl_table
11
note
Evidence 1a: Function experimentally demonstrated in the studied strain; PubMedId: 15849754, 16484183, 16850406, 2509435, 9622350; Product type cp: cell process
db_xref
GI:2633892
protein_id
CAB13394.1
Genomic View of Gene/Segment spoVE Show/Hide
(Legend)