| Start Page |
|
 |
| Start Page |
|
|
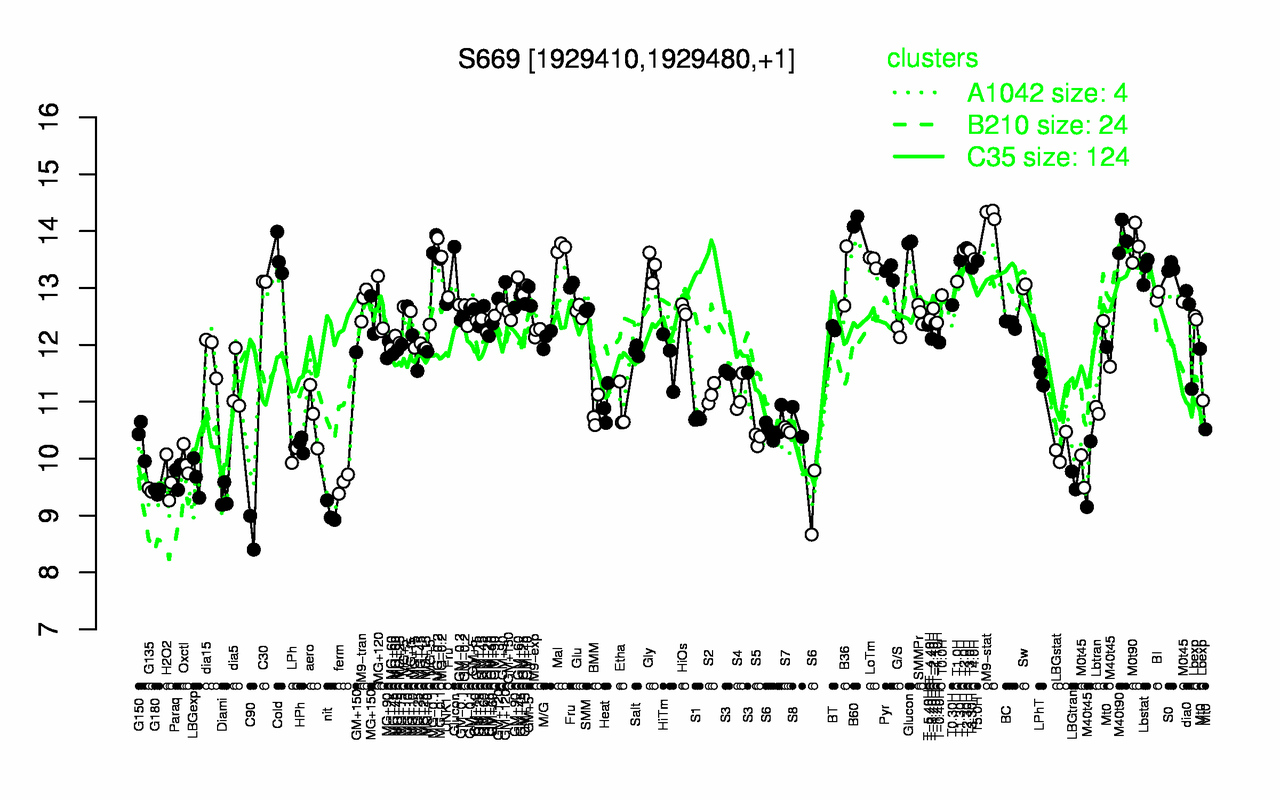
| M9-stat | B60 | M40t90 | Glucon | M0t90 | MG-0.2 | Mal | T2.30H | MG-0.1 | T2.0H |
| 14.3 | 14.2 | 13.9 | 13.8 | 13.8 | 13.7 | 13.7 | 13.7 | 13.7 | 13.7 |
| C90 | nit | Diami | G180 | G135 | ferm | LBGtran | H2O2 | LBGexp | Paraq |
| 8.7 | 9.05 | 9.33 | 9.43 | 9.45 | 9.57 | 9.62 | 9.64 | 9.67 | 9.71 |