| Start Page |
|
 |
| Start Page |
|
|
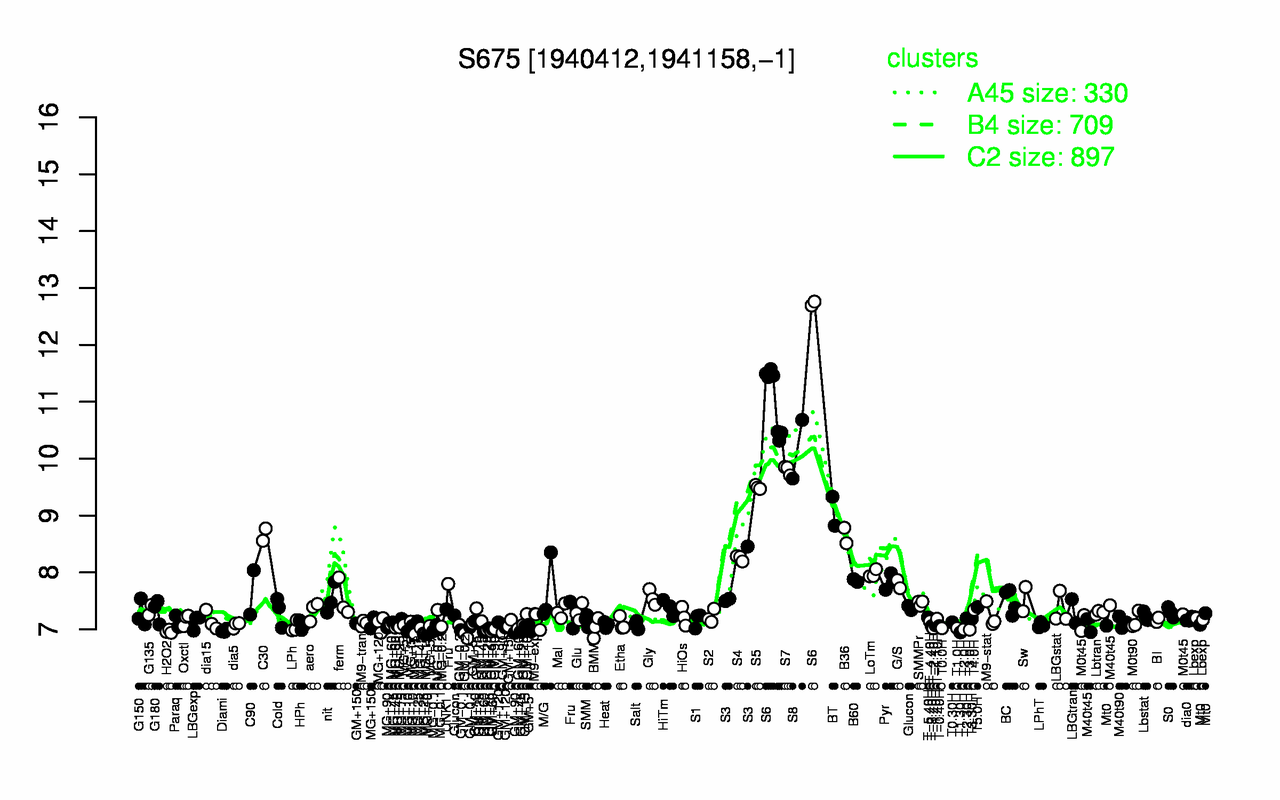
| S6 | S8 | S7 | S5 | BT | C30 | B36 | S4 | LoTm | B60 |
| 11.4 | 10.2 | 9.8 | 9.5 | 9.08 | 8.66 | 8.65 | 8.25 | 7.98 | 7.86 |
| T1.30H | GM-0.2 | GM+90 | H2O2 | Diami | MG+10 | GM+60 | GM-0.1 | T3.0H | T2.0H |
| 6.95 | 6.95 | 6.96 | 6.96 | 6.98 | 6.98 | 6.99 | 6.99 | 6.99 | 7 |