| Start Page |
|
 |
| Start Page |
|
|
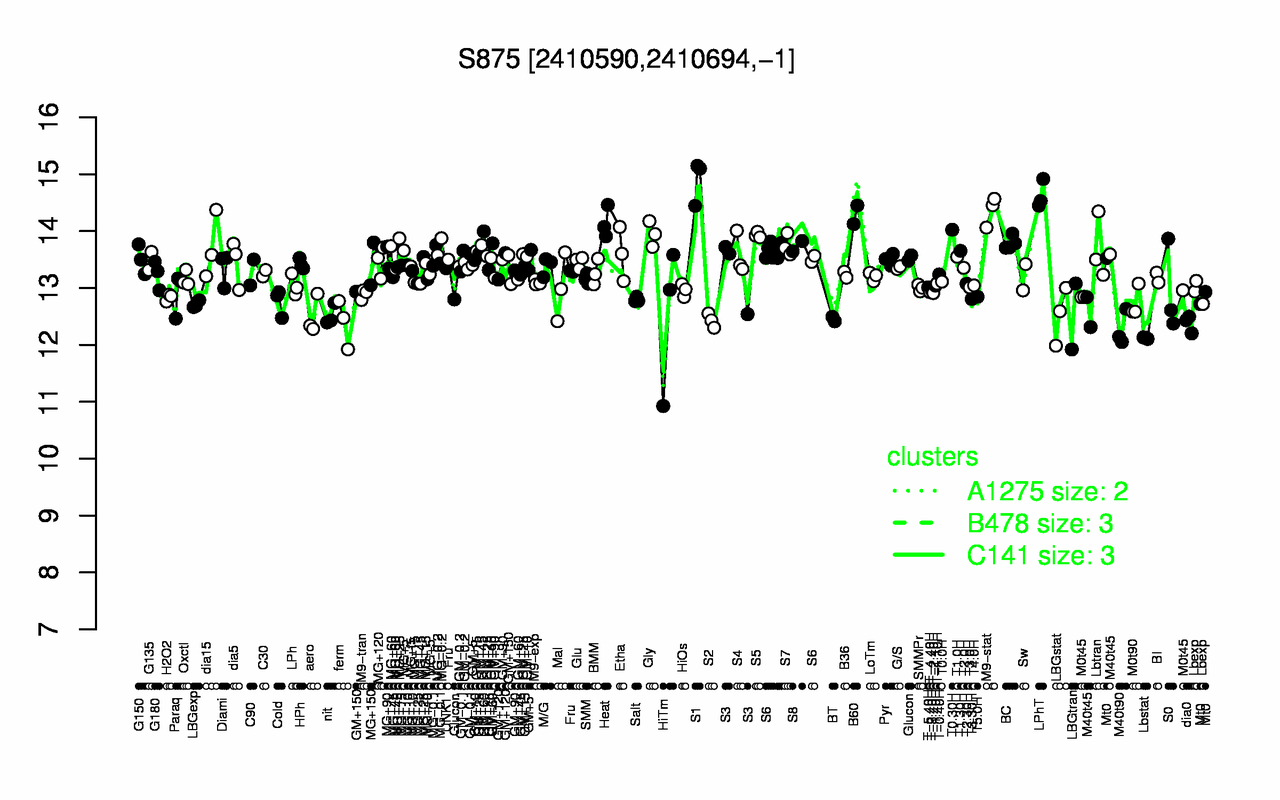
| S1 | LPhT | M9-stat | B60 | Heat | T0.30H | Gly | S5 | BC | S7 |
| 14.9 | 14.6 | 14.4 | 14.3 | 14.1 | 14 | 13.9 | 13.9 | 13.8 | 13.8 |
| Lbstat | M40t90 | dia0 | ferm | S2 | BT | HiTm | LBGtran | aero | nit |
| 12.1 | 12.3 | 12.4 | 12.4 | 12.4 | 12.5 | 12.5 | 12.5 | 12.5 | 12.5 |