| Start Page |
|
 |
| Start Page |
|
|
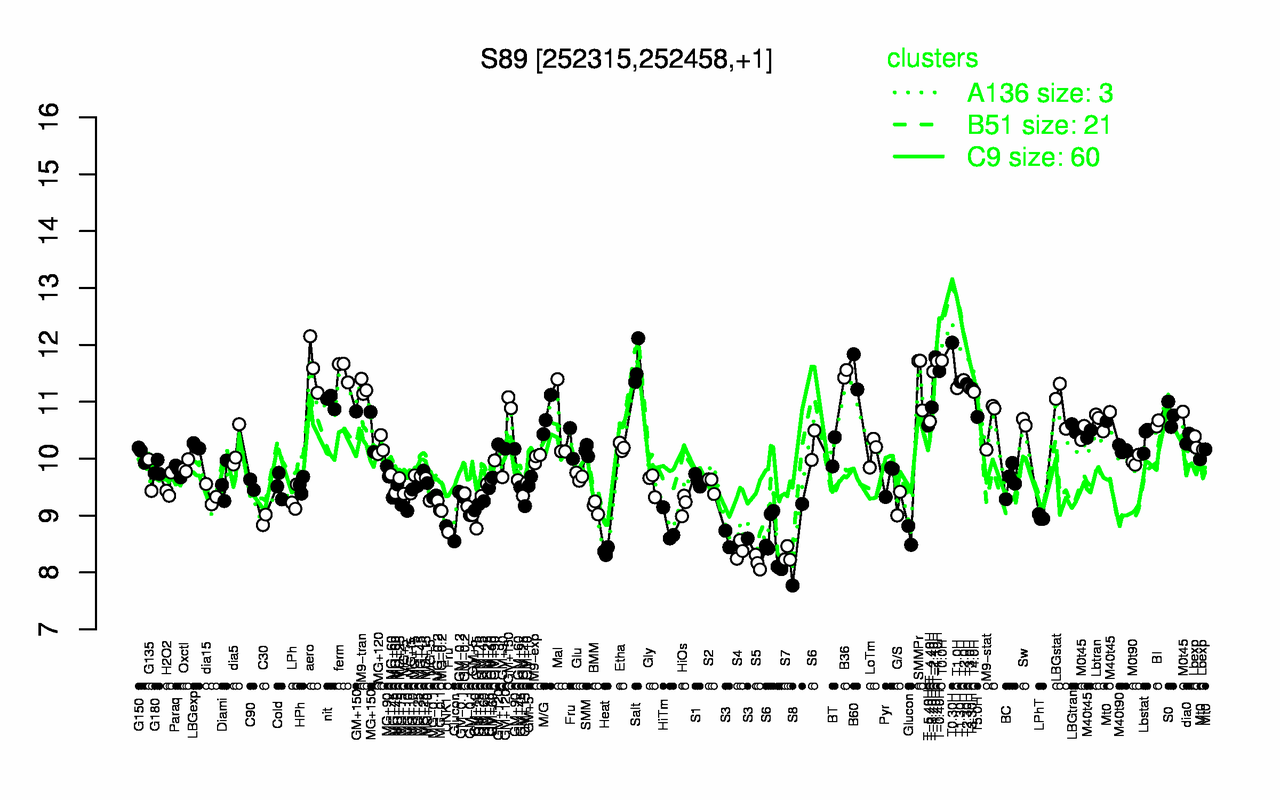
| T0.30H | T-1.40H | T0.0H | T-1.10H | Salt | aero | ferm | T-0.40H | T-2.40H | B60 |
| 12 | 11.8 | 11.7 | 11.7 | 11.7 | 11.6 | 11.6 | 11.5 | 11.5 | 11.5 |
| S5 | S7 | Heat | S4 | S8 | S3 | Glucon | HiTm | UNK1 | S6 |
| 8.18 | 8.31 | 8.37 | 8.4 | 8.49 | 8.59 | 8.62 | 8.8 | 8.81 | 8.86 |