| Start Page |
|
 |
| Start Page |
|
|
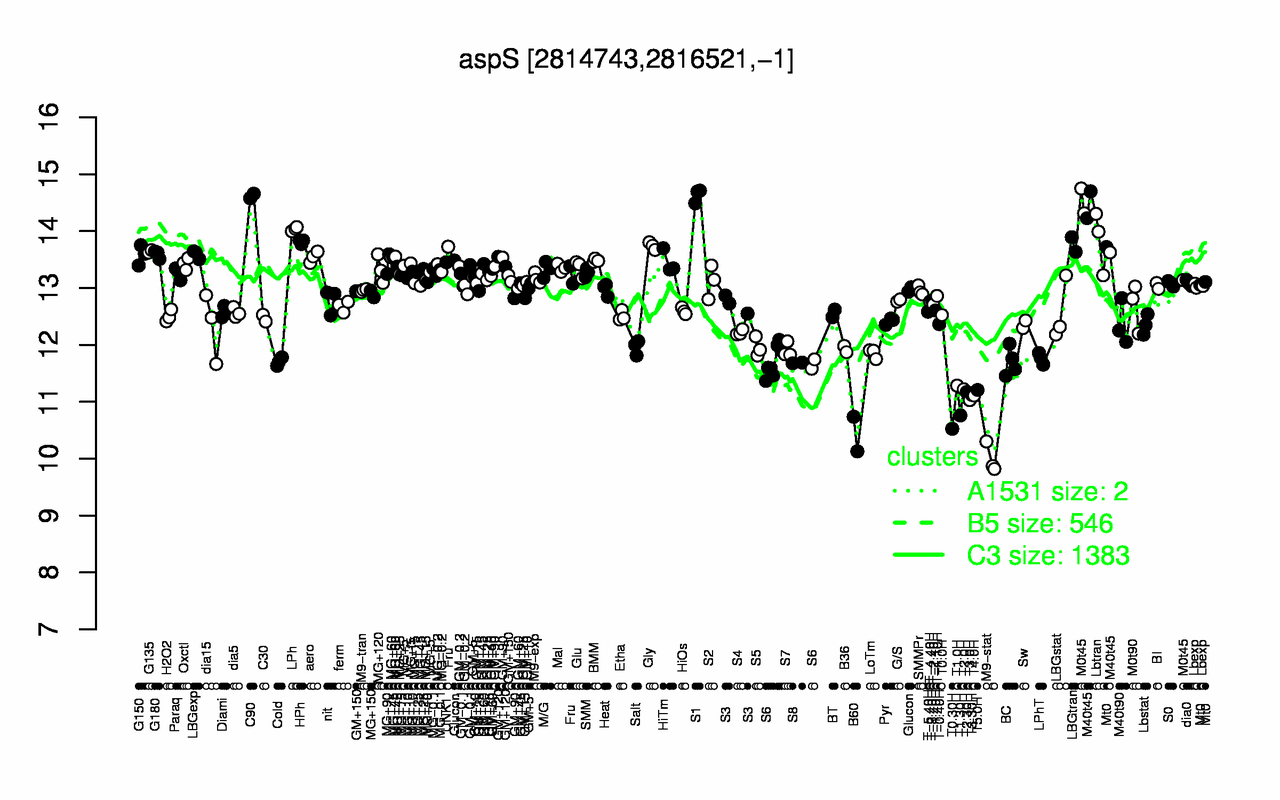
| S1 | C90 | M40t45 | M0t45 | LPh | Lbtran | HPh | LBGtran | Gly | G135 |
| 14.6 | 14.6 | 14.2 | 14.1 | 14 | 13.8 | 13.8 | 13.8 | 13.7 | 13.6 |
| M9-stat | B60 | T0.30H | T1.30H | T3.0H | T4.0H | T3.30H | T2.30H | T5.0H | T2.0H |
| 10 | 10.4 | 10.5 | 10.8 | 11 | 11.1 | 11.1 | 11.2 | 11.2 | 11.2 |