| Start Page |
|
 |
| Start Page |
|
|
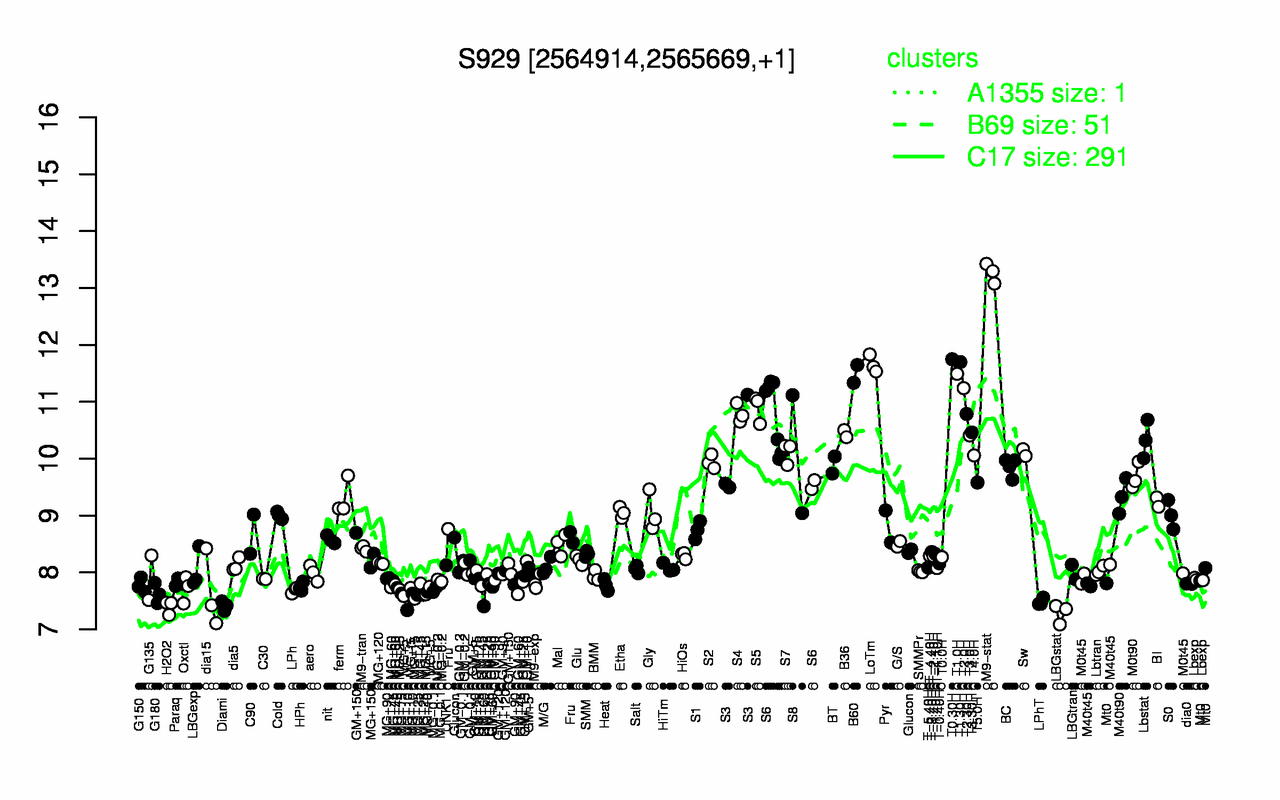
| M9-stat | T0.30H | T1.30H | LoTm | T1.0H | B60 | T2.0H | S5 | S4 | T2.30H |
| 13.3 | 11.7 | 11.7 | 11.7 | 11.5 | 11.5 | 11.2 | 10.9 | 10.8 | 10.8 |
| LBGstat | H2O2 | Diami | LPhT | MG+10 | GM+60 | MG+15 | G180 | MG+25 | dia15 |
| 7.28 | 7.39 | 7.41 | 7.48 | 7.54 | 7.59 | 7.59 | 7.63 | 7.64 | 7.65 |