| Start Page |
|
 |
| Start Page |
|
|
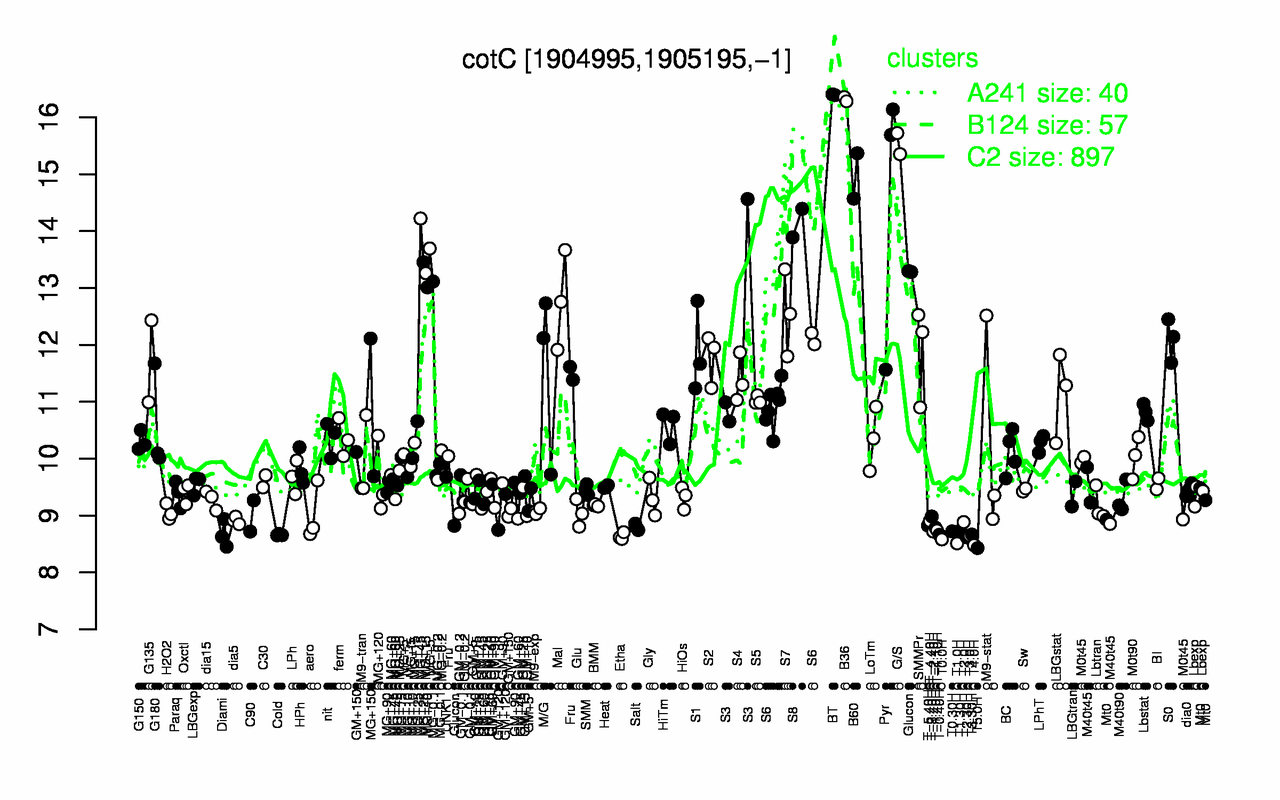
| BT | B36 | G/S | B60 | Pyr | S8 | Mal | S7 | S0 | S3 |
| 16.4 | 16.3 | 15.5 | 15 | 14.5 | 14.1 | 12.8 | 12.6 | 12.1 | 12.1 |
| T5.0H | T4.0H | T1.0H | T0.0H | T2.30H | Etha | T3.0H | Cold | T-0.40H | T3.30H |
| 8.43 | 8.48 | 8.51 | 8.58 | 8.62 | 8.64 | 8.65 | 8.66 | 8.66 | 8.67 |