B. subtilis Expression Data Browser
Start Page
B. subtilis Expression Data Browser
Gene/Segment:
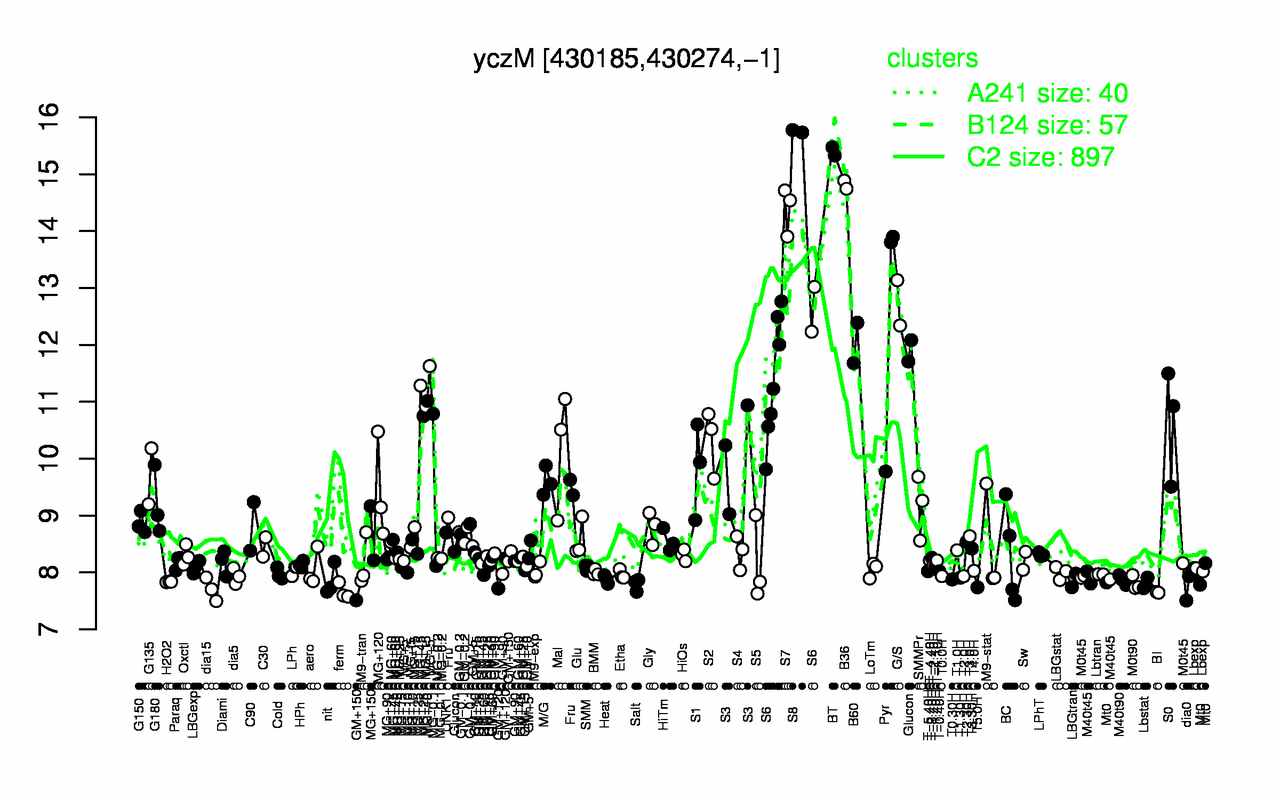
yczM
Locus Tag:
BSU03788
Details about yczM
Show/Hide
Highest Expression Conditions
S8
BT
B36
S7
G/S
Pyr
B60
S6
Glucon
S0
15.8
15.4
14.8
14.4
12.7
12.5
12
11.7
10.7
10.6
Lowest Expression Conditions
BI
ferm
dia15
T5.0H
Salt
Lbstat
M0t90
dia0
H2O2
LBGtran
7.65
7.67
7.7
7.74
7.79
7.8
7.81
7.81
7.83
7.86
Most Positively Correlated Segments
yosA
S771
yurS
ypzD
sspG
S665
yczN
cgeB
cgeA
yfnF
0.95
0.95
0.94
0.93
0.93
0.92
0.92
0.91
0.9
0.9
Most Negatively Correlated Segments
ydhC
moeB
ydeM
S552
aroC
ydfL
ydiL
S1356
bceR
yjbM
-0.71
-0.67
-0.66
-0.66
-0.66
-0.66
-0.65
-0.65
-0.65
-0.65
Expression Profile of Segment yczM
Show/Hide
Annotation of Gene yczM
Show/Hide
inference
ab initio prediction:AMIGene:2.0
codon_start
1
product
hypothetical protein
transl_table
11
note
Evidence 6: Doubtful CDS
db_xref
GI:225184745
protein_id
CAX52547.1
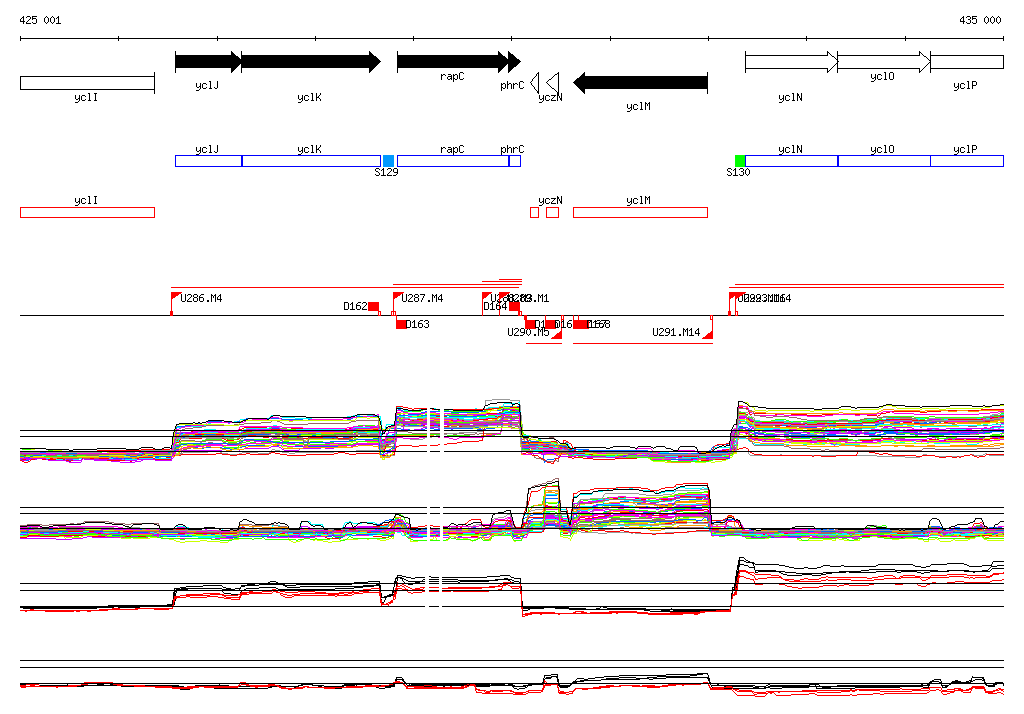
Genomic View of Gene/Segment yczM
Show/Hide
(Legend)
Browse Genome Context