| Start Page |
|
 |
| Start Page |
|
|
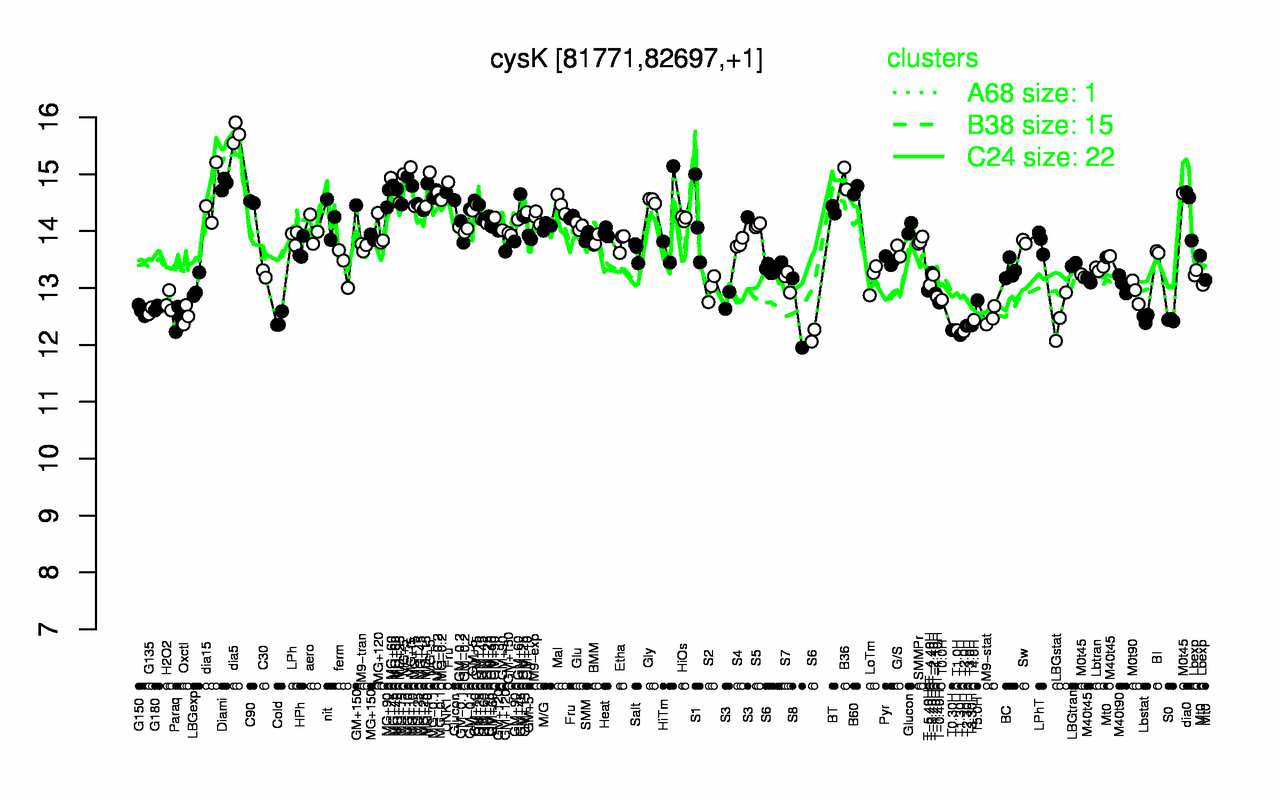
| dia5 | MG+t5 | MG+5 | B36 | MG+10 | MG+60 | Diami | B60 | UNK1 | MG+45 |
| 15.7 | 15.1 | 15 | 14.9 | 14.9 | 14.8 | 14.8 | 14.7 | 14.7 | 14.7 |
| T1.30H | T2.0H | T1.0H | T0.30H | T2.30H | T3.0H | T3.30H | Cold | S0 | T4.0H |
| 12.2 | 12.2 | 12.3 | 12.3 | 12.3 | 12.3 | 12.3 | 12.4 | 12.4 | 12.4 |