| Start Page |
|
 |
| Start Page |
|
|
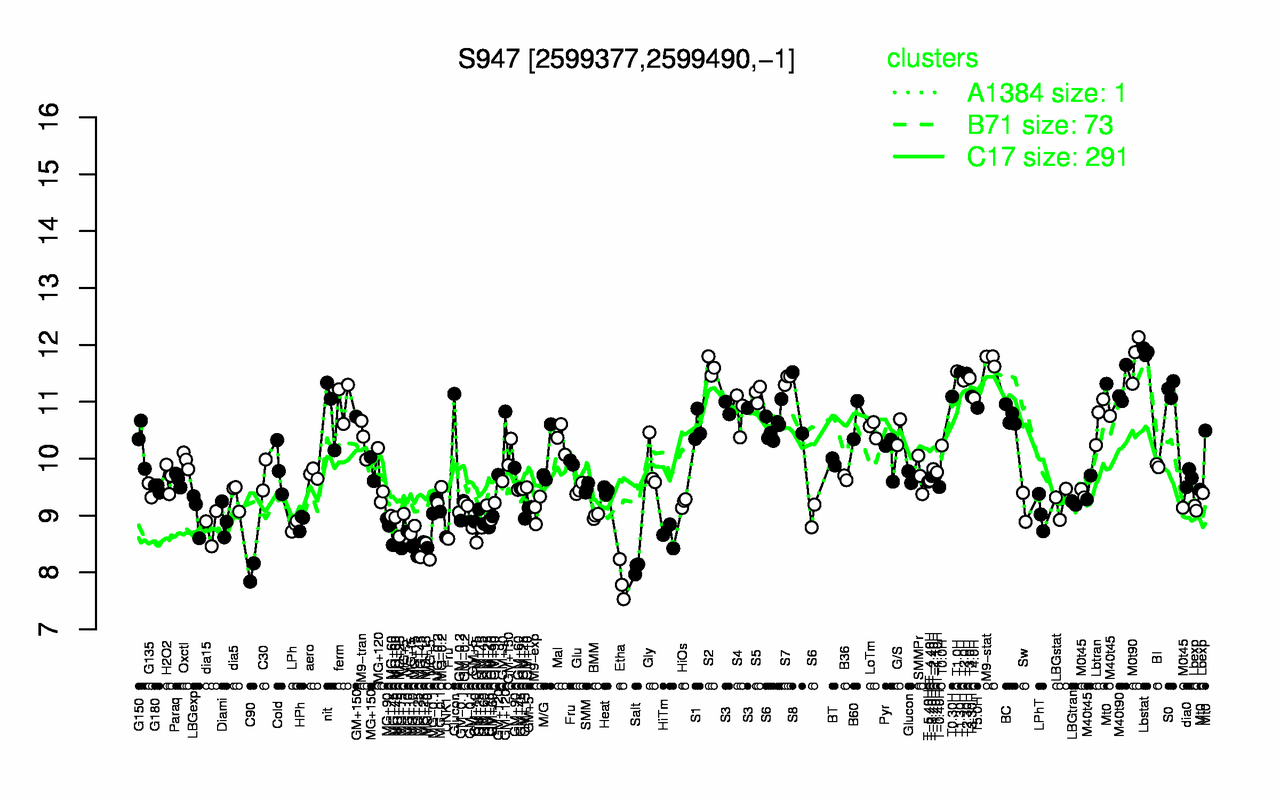
| Lbstat | M0t90 | M9-stat | S2 | T1.0H | T1.30H | T2.30H | T3.0H | S7 | T2.0H |
| 11.9 | 11.8 | 11.7 | 11.6 | 11.5 | 11.5 | 11.5 | 11.4 | 11.4 | 11.4 |
| Etha | C90 | Salt | MG+45 | MG+25 | MG+10 | MG+15 | UNK1 | MG+5 | HiTm |
| 7.85 | 8 | 8.08 | 8.42 | 8.48 | 8.54 | 8.59 | 8.62 | 8.63 | 8.64 |