| Start Page |
|
 |
| Start Page |
|
|
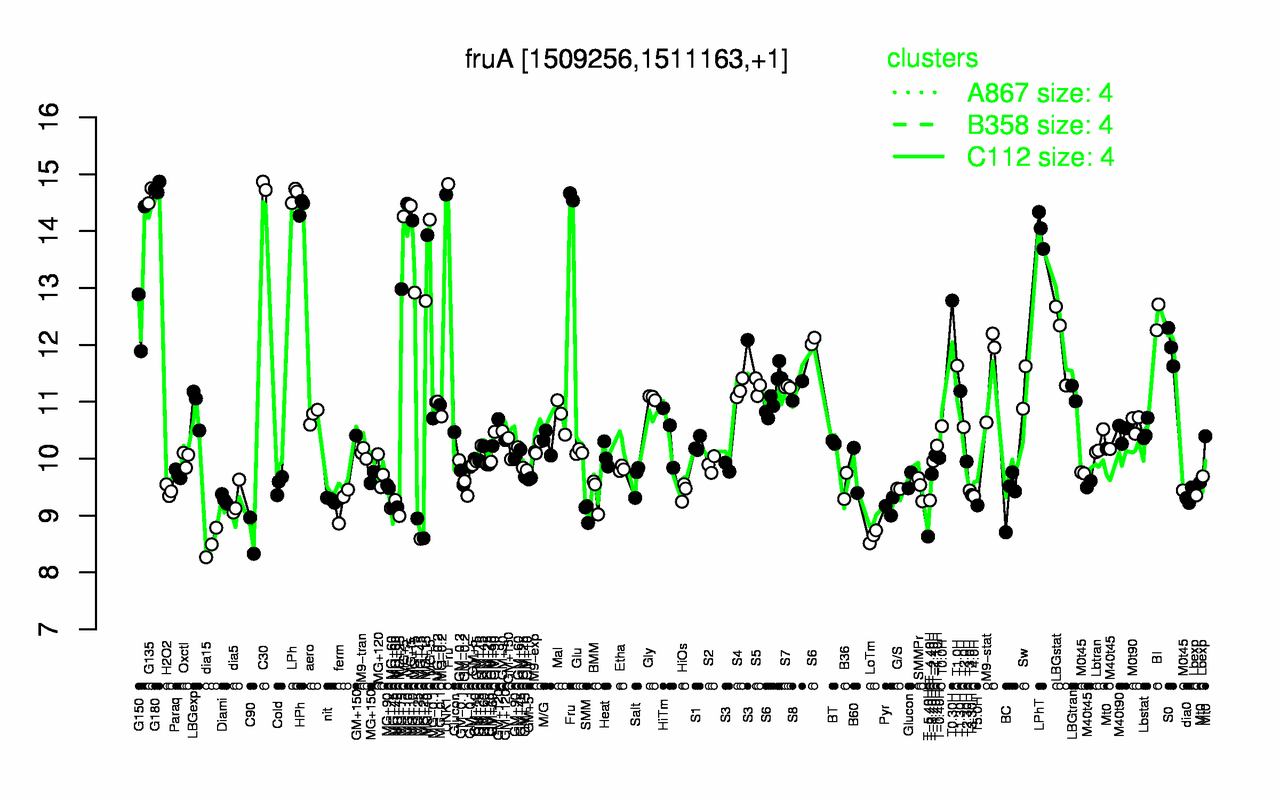
| C30 | G180 | Fru | LPh | UNK1 | G135 | MG+t5 | HPh | MG+5 | MG+10 |
| 14.8 | 14.8 | 14.7 | 14.6 | 14.6 | 14.6 | 14.4 | 14.4 | 14.2 | 14.2 |
| dia15 | T-5.40H | LoTm | C90 | MG+25 | MG+45 | SMM | Pyr | T5.0H | MG+60 |
| 8.52 | 8.63 | 8.63 | 8.65 | 8.85 | 8.96 | 9.06 | 9.16 | 9.18 | 9.2 |