| Start Page |
|
 |
| Start Page |
|
|
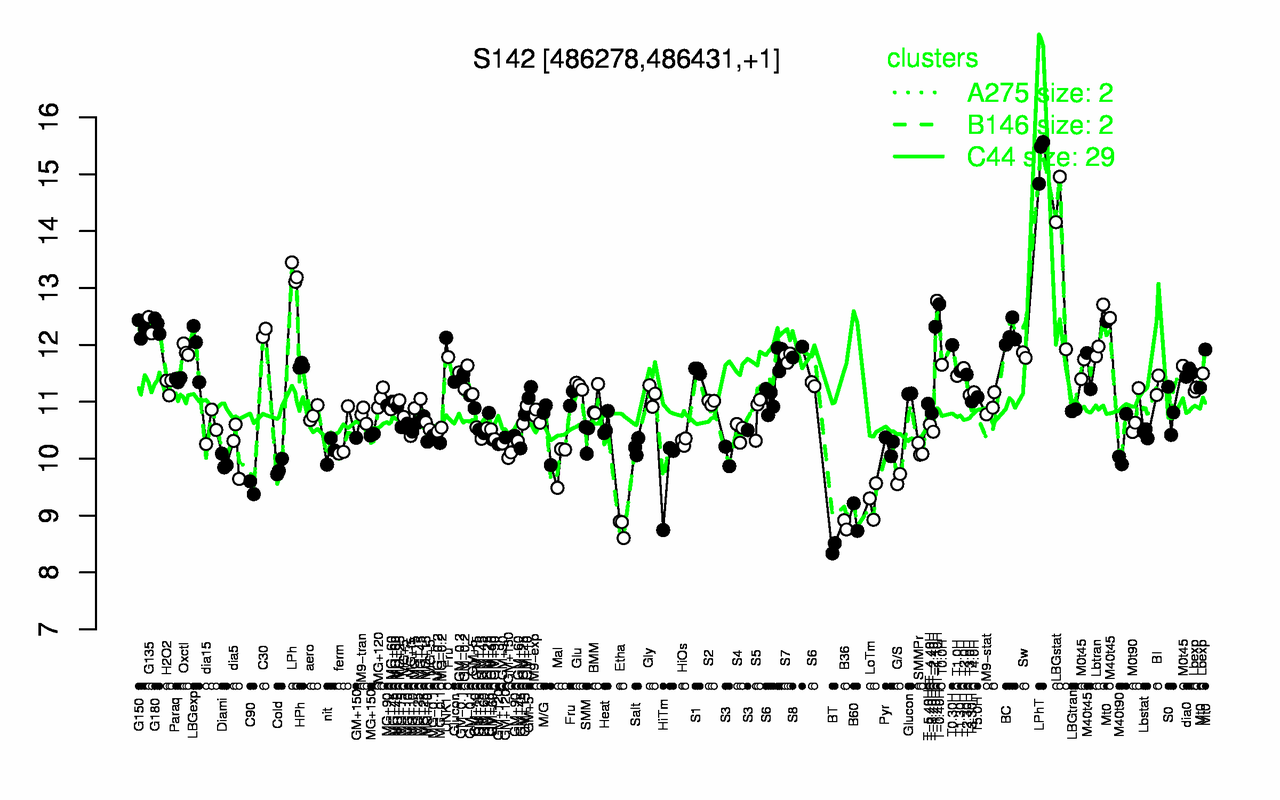
| LPhT | LBGstat | LPh | T-1.10H | T-0.40H | G135 | G180 | T-1.40H | G150 | C30 |
| 15.3 | 13.7 | 13.2 | 12.8 | 12.7 | 12.3 | 12.3 | 12.3 | 12.3 | 12.2 |
| BT | Etha | B36 | B60 | LoTm | C90 | G/S | HiTm | Cold | Mal |
| 8.42 | 8.79 | 8.84 | 8.97 | 9.26 | 9.49 | 9.64 | 9.69 | 9.84 | 9.94 |