B. subtilis Expression Data Browser
Details about ftsL Show/Hide
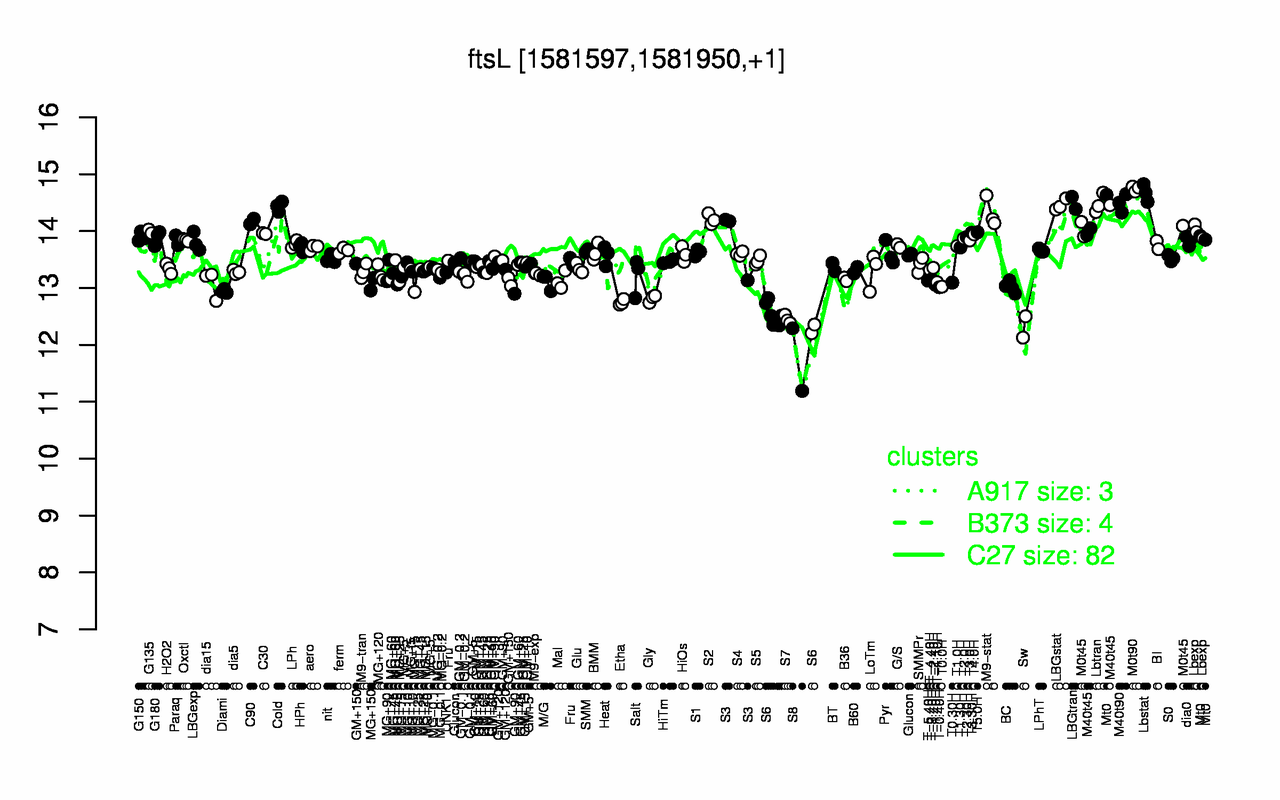
Highest Expression Conditions
M0t90 Lbstat LBGtran M40t90 Lbtran LBGstat Cold M9-stat S2 C90
14.7 14.7 14.5 14.5 14.5 14.5 14.4 14.3 14.2 14.2
Lowest Expression Conditions
S8 Sw S7 S6 Etha Gly Diami T-0.40H BC T0.0H
11.7 12.3 12.4 12.5 12.7 12.8 12.9 13 13 13
Most Positively Correlated Segments
mraW mraZ pbpB ymfM S508 yvcQ secDF S880 rluB gudB
0.88 0.81 0.81 0.66 0.65 0.65 0.63 0.63 0.63 0.63
Most Negatively Correlated Segments
yjnA yuzF yueE S190 yflB S115 mecB ywmE ykzH ytaB
-0.64 -0.6 -0.59 -0.59 -0.58 -0.56 -0.54 -0.54 -0.54 -0.53
Expression Profile of Segment ftsL Show/Hide
Annotation of Gene ftsL Show/Hide
function
16.13: Shape
function
16.3: Control
inference
ab initio prediction:AMIGene:2.0
codon_start
1
product
cell-division protein
transl_table
11
note
Evidence 1a: Function experimentally demonstrated in the studied strain; PubMedId: 10792716, 10844672, 11994149, 16549676, 16936019, 17020588; Product type cp : cell process
db_xref
GI:2633886
protein_id
CAB13388.1
Genomic View of Gene/Segment ftsL Show/Hide
(Legend)