| Start Page |
|
 |
| Start Page |
|
|
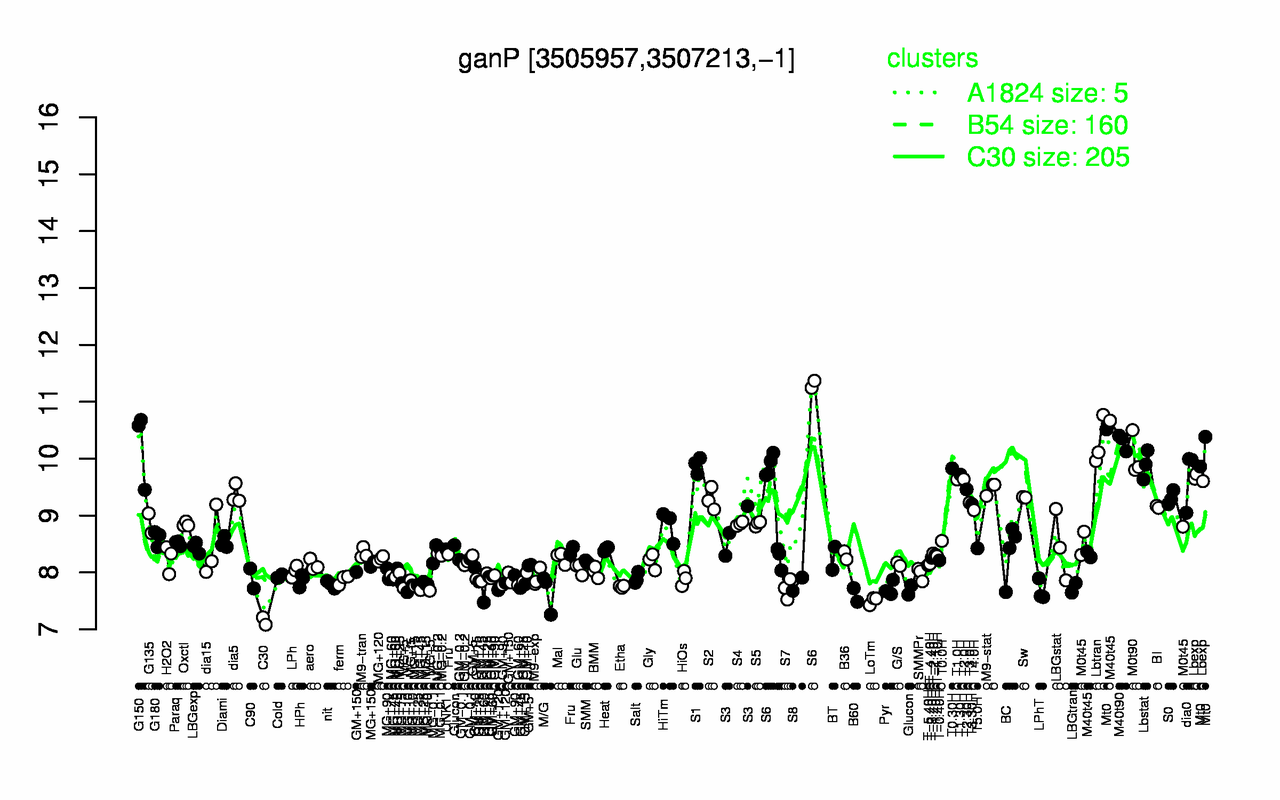
| M40t90 | Lbtran | Mt0 | G150 | M0t90 | Lbstat | S1 | T0.30H | T1.30H | dia0 |
| 10.3 | 10.3 | 10.3 | 10.2 | 10.1 | 9.89 | 9.89 | 9.83 | 9.72 | 9.67 |
| C30 | LoTm | B60 | M/G | LPhT | MG+5 | S7 | Pyr | LBGtran | GM+60 |
| 7.15 | 7.5 | 7.6 | 7.66 | 7.68 | 7.7 | 7.71 | 7.72 | 7.73 | 7.73 |