| Start Page |
|
 |
| Start Page |
|
|
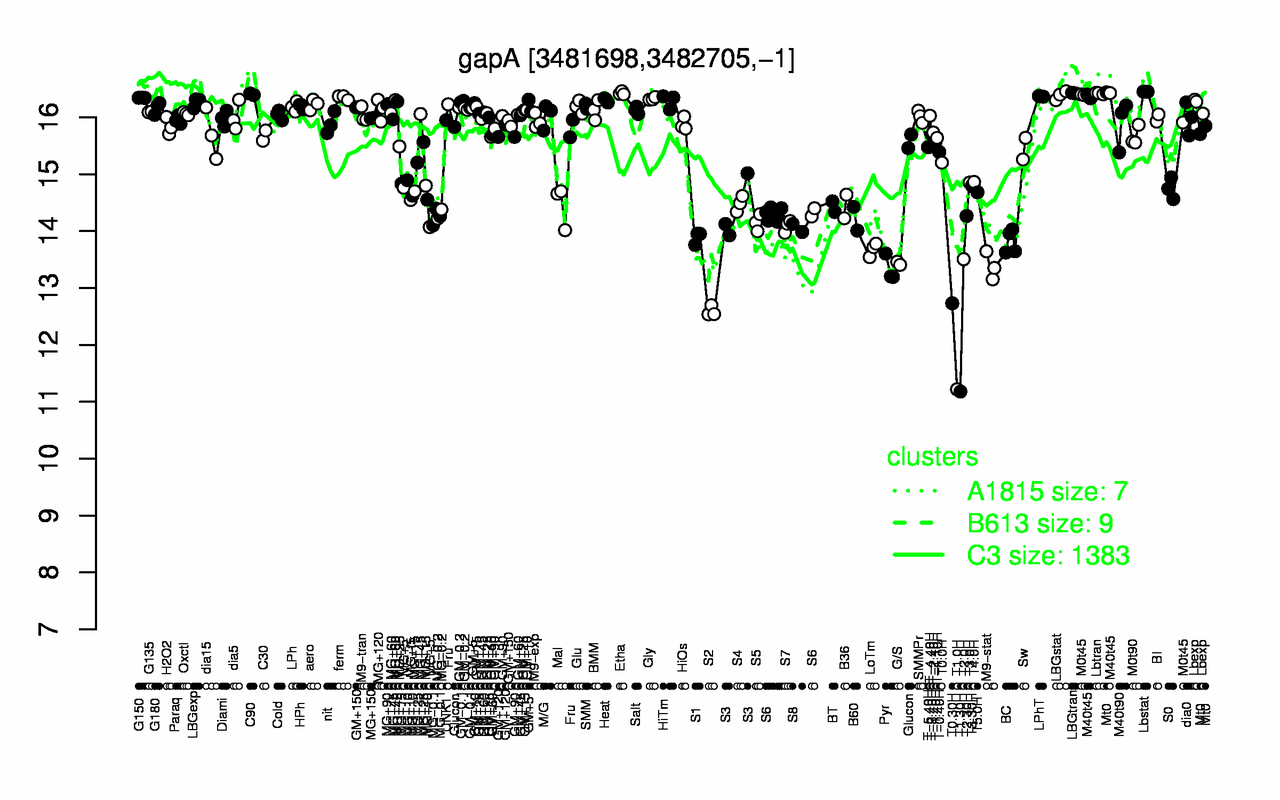
| Lbstat | LBGtran | Etha | Lbtran | C90 | M40t45 | LBGstat | LPhT | ferm | G150 |
| 16.5 | 16.4 | 16.4 | 16.4 | 16.4 | 16.4 | 16.4 | 16.4 | 16.3 | 16.3 |
| T1.30H | T1.0H | S2 | T0.30H | Pyr | M9-stat | G/S | T2.0H | LoTm | BC |
| 11.2 | 11.2 | 12.6 | 12.7 | 13.3 | 13.4 | 13.4 | 13.5 | 13.7 | 13.8 |