B. subtilis Expression Data Browser
Start Page
B. subtilis Expression Data Browser
Gene/Segment:
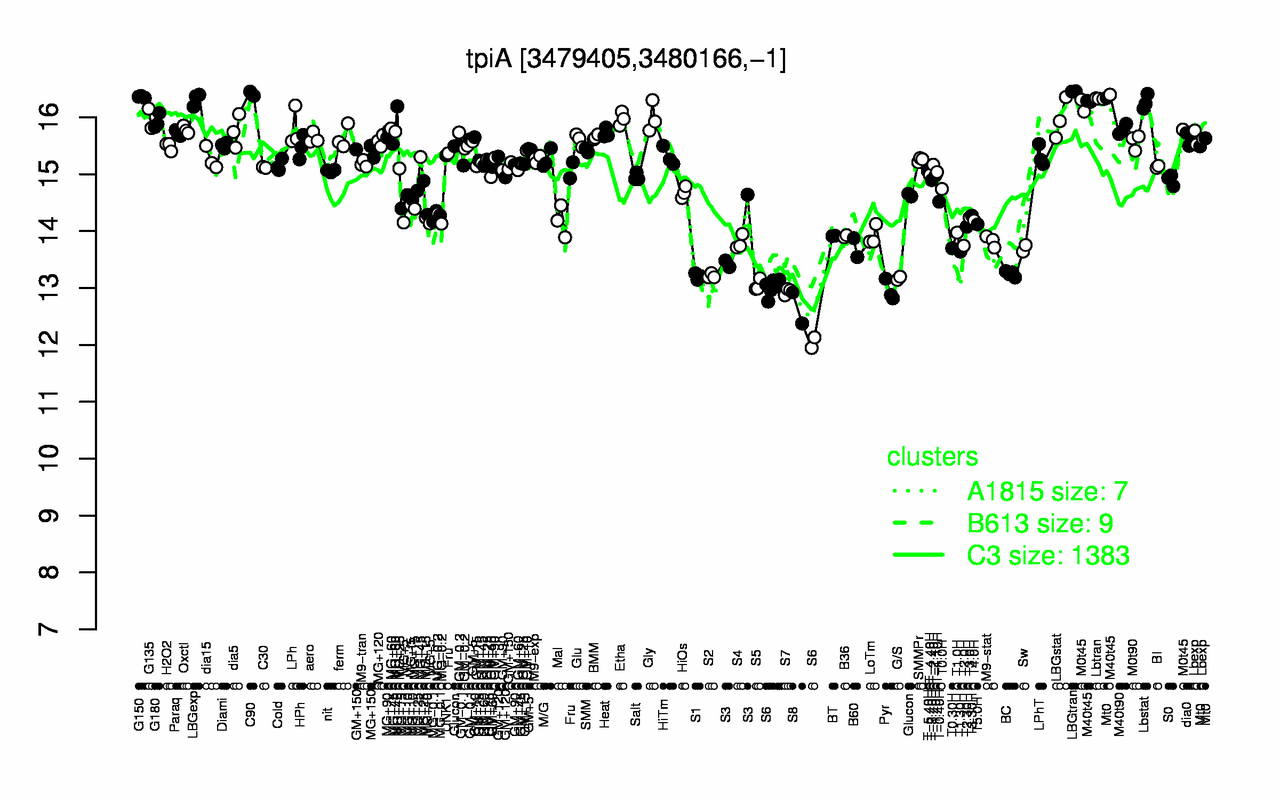
tpiA
Locus Tag:
BSU33920
Details about tpiA
Show/Hide
Highest Expression Conditions
LBGtran
C90
G150
Lbtran
M40t45
LBGexp
Lbstat
M0t45
Gly
G135
16.5
16.4
16.4
16.3
16.3
16.3
16.3
16.1
16
16
Lowest Expression Conditions
S8
S6
S7
Pyr
S5
G/S
S1
S2
BC
T1.30H
12.6
12.8
12.9
13
13
13.2
13.2
13.2
13.2
13.6
Most Positively Correlated Segments
pgk
pgm
eno
S1300
S1301
gapA
S1102
ccpN
pyk
yqfL
0.99
0.99
0.98
0.97
0.9
0.87
0.83
0.82
0.82
0.81
Most Negatively Correlated Segments
ybbC
S471
ispA
ybfJ
ybbD
S314
yjbA
ybbE
mpr
yngJ
-0.78
-0.77
-0.77
-0.77
-0.76
-0.76
-0.76
-0.76
-0.76
-0.75
Expression Profile of Segment tpiA
Show/Hide
Annotation of Gene tpiA
Show/Hide
function
16.2: Construct biomass (Anabolism)
inference
ab initio prediction:AMIGene:2.0
codon_start
1
EC_number
5.3.1.1
transl_table
11
note
Evidence 2a: Function of homologous gene experimentally demonstrated in an other organism; PubMedId: 12682299, 8021172; Product type e: enzyme
db_xref
GI:2635905
product
triose phosphate isomerase
protein_id
CAB15397.1
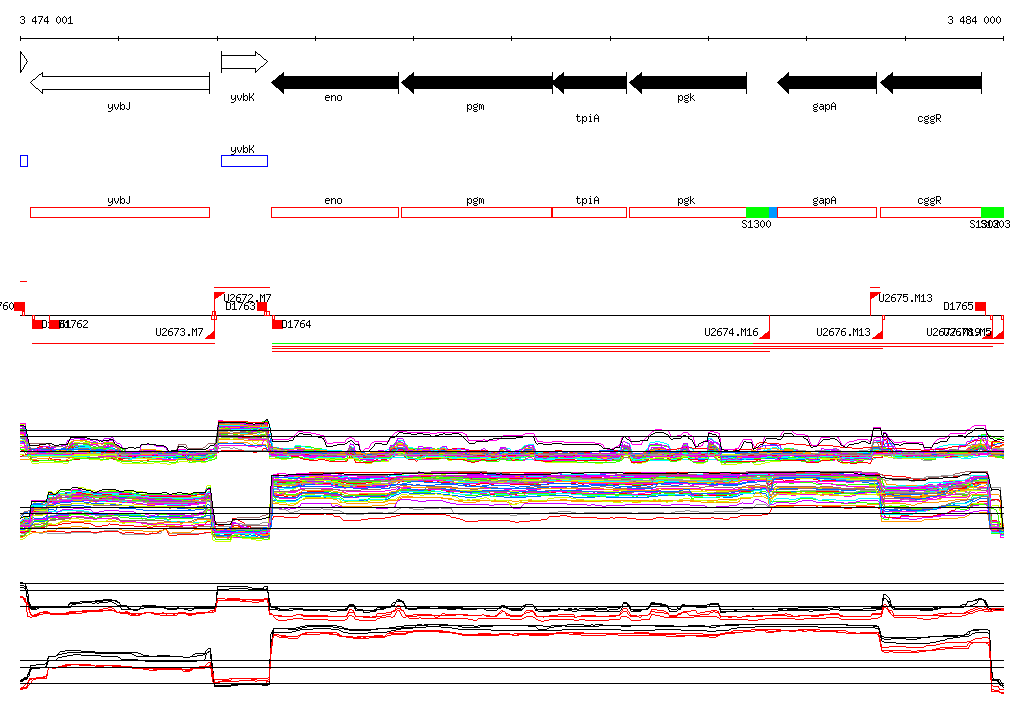
Genomic View of Gene/Segment tpiA
Show/Hide
(Legend)
Browse Genome Context