| Start Page |
|
 |
| Start Page |
|
|
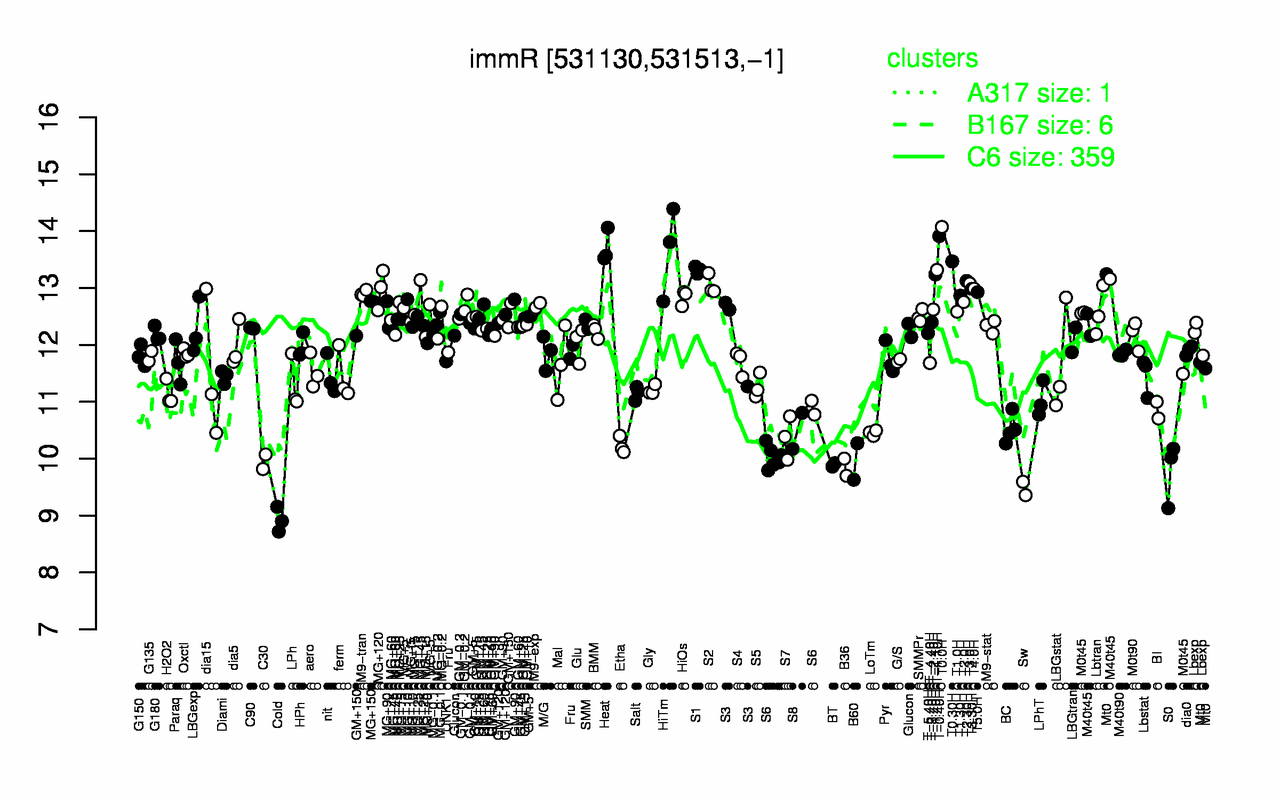
| T0.0H | T-0.40H | Heat | HiTm | T0.30H | T-1.10H | S1 | T-1.40H | T2.30H | T3.0H |
| 14.1 | 13.9 | 13.7 | 13.7 | 13.5 | 13.3 | 13.3 | 13.2 | 13.1 | 13.1 |
| Cold | Sw | S0 | B36 | BT | C30 | B60 | S6 | Etha | S7 |
| 8.92 | 9.48 | 9.77 | 9.85 | 9.89 | 9.95 | 9.95 | 10.2 | 10.2 | 10.4 |