| Start Page |
|
 |
| Start Page |
|
|
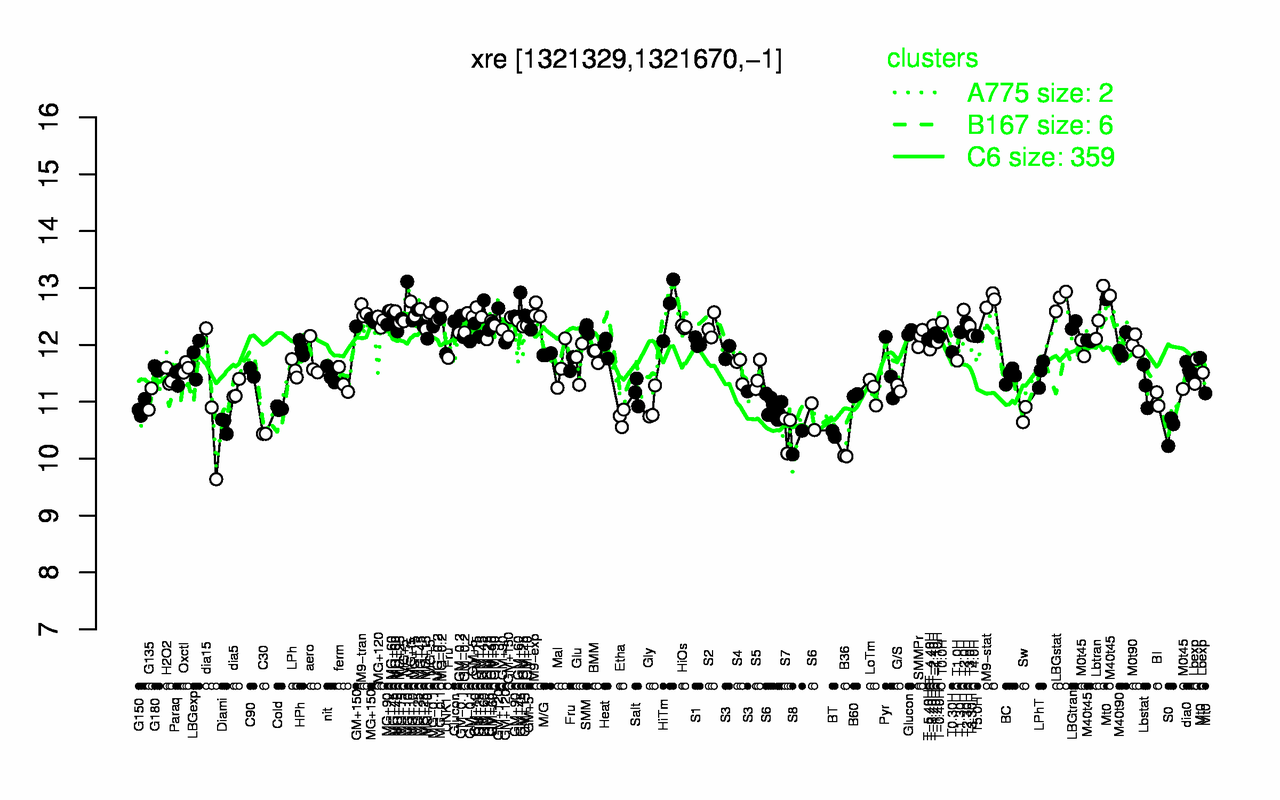
| M9-stat | LBGstat | MG+t5 | HiTm | T2.0H | GM+45 | MG+60 | M9-tran | M9-exp | MG-0.2 |
| 12.8 | 12.8 | 12.8 | 12.6 | 12.6 | 12.6 | 12.6 | 12.6 | 12.6 | 12.6 |
| B36 | S8 | BT | C30 | S7 | S0 | Diami | Etha | Sw | S6 |
| 10 | 10.3 | 10.4 | 10.4 | 10.5 | 10.5 | 10.6 | 10.7 | 10.8 | 10.9 |