| Start Page |
|
 |
| Start Page |
|
|
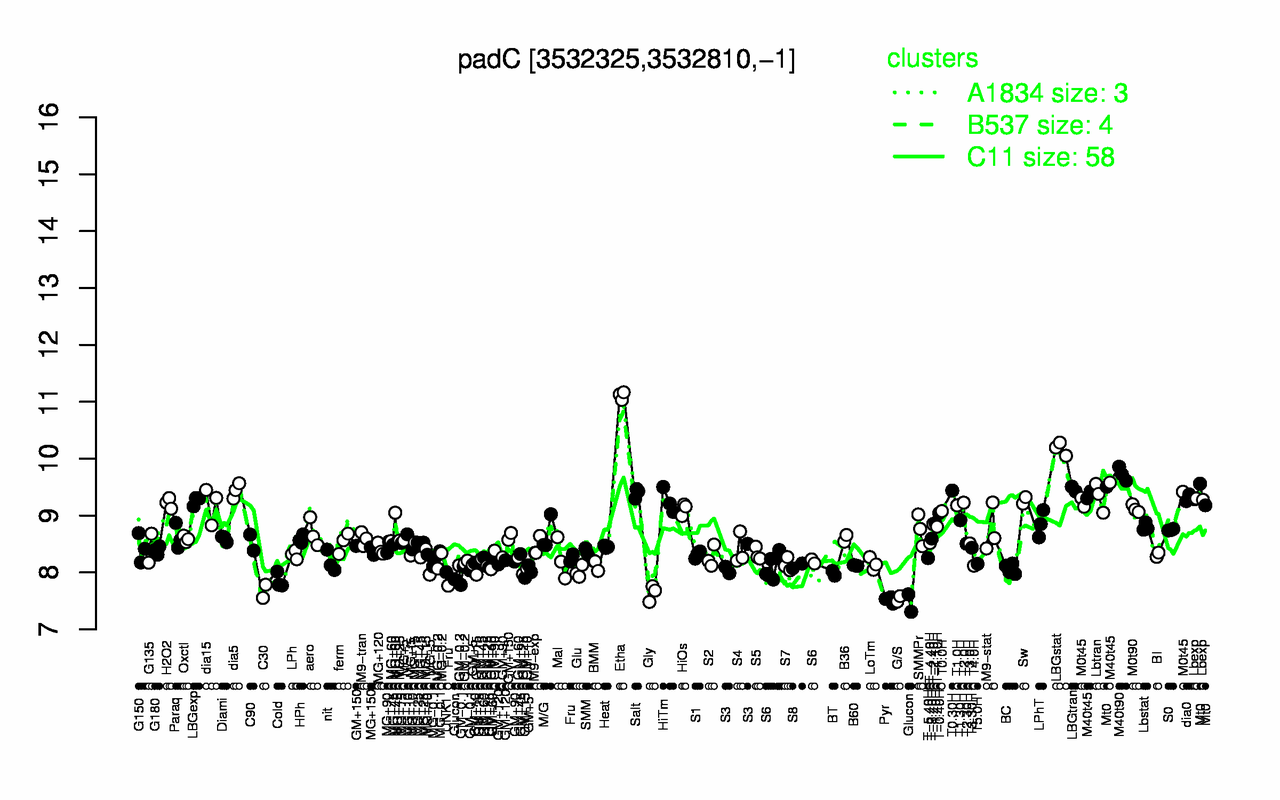
| Etha | LBGstat | M40t90 | LBGtran | T0.30H | dia5 | M40t45 | Mt0 | Salt | Lbtran |
| 11.1 | 10.2 | 9.73 | 9.47 | 9.44 | 9.44 | 9.43 | 9.42 | 9.4 | 9.33 |
| Pyr | G/S | Glucon | Gly | C30 | Cold | GM-0.1 | GM+15 | BT | UNK1 |
| 7.52 | 7.54 | 7.6 | 7.64 | 7.67 | 7.86 | 7.97 | 7.98 | 7.99 | 8.01 |