| Start Page |
|
 |
| Start Page |
|
|
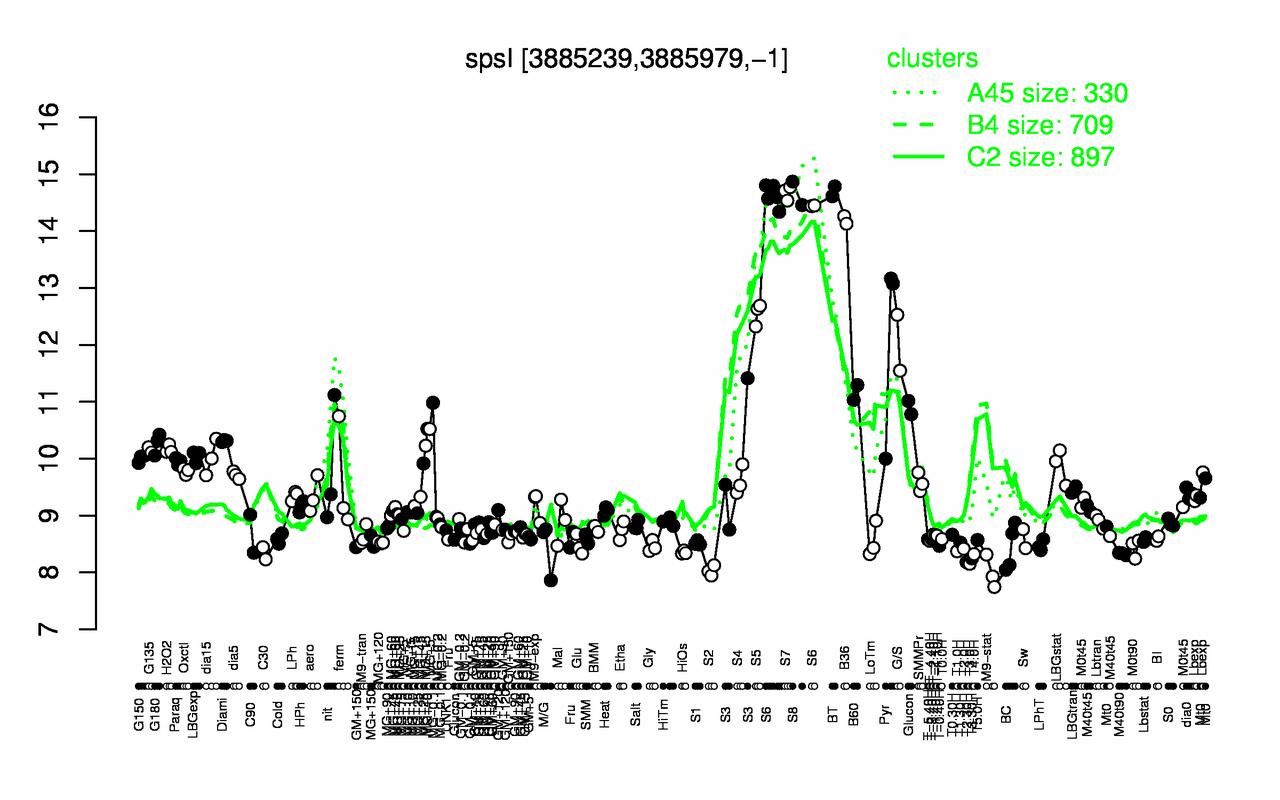
| BT | S7 | S8 | S6 | B36 | S5 | Pyr | G/S | B60 | Diami |
| 14.7 | 14.7 | 14.7 | 14.6 | 14.2 | 12.5 | 12.1 | 12 | 11.2 | 10.3 |
| M9-stat | S2 | T3.0H | T2.30H | T3.30H | T4.0H | M40t90 | C30 | HiOs | T1.0H |
| 8 | 8.03 | 8.15 | 8.18 | 8.24 | 8.32 | 8.33 | 8.34 | 8.35 | 8.37 |