| Start Page |
|
 |
| Start Page |
|
|
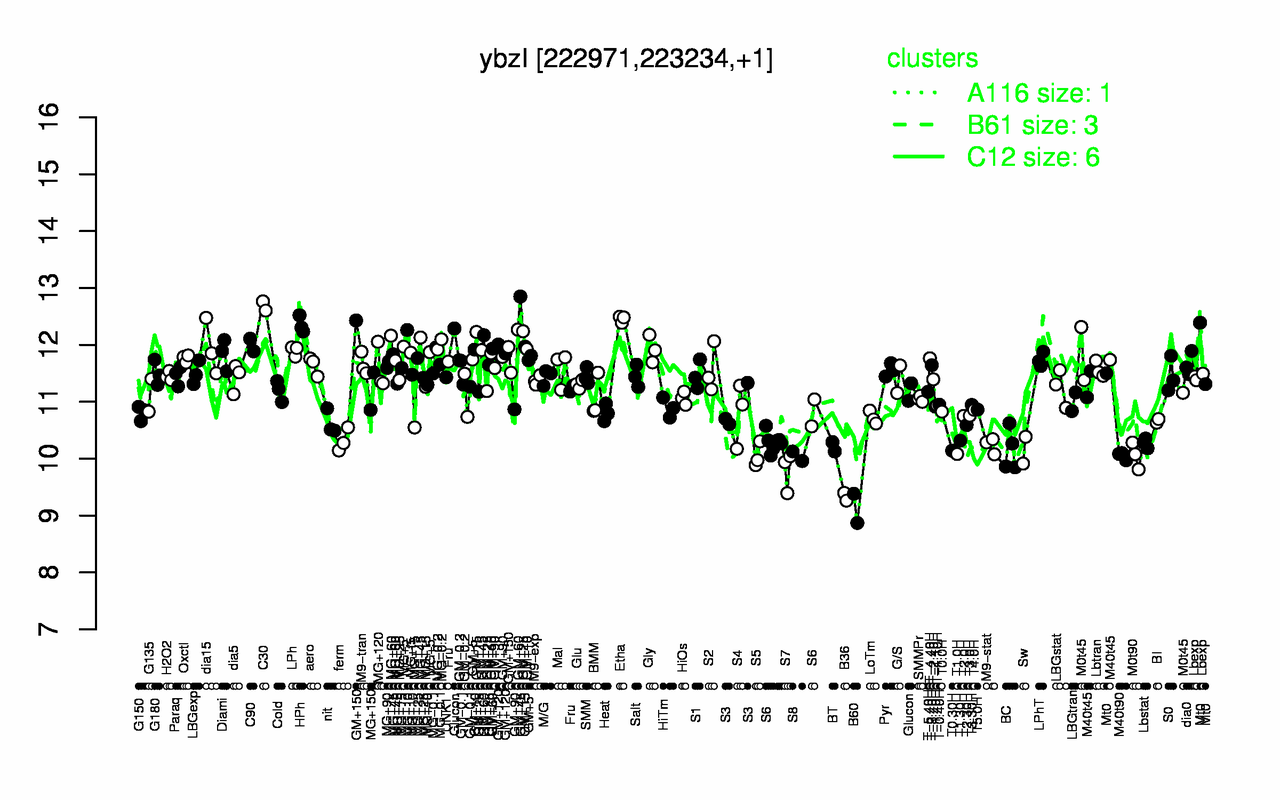
| C30 | Etha | HPh | GM+45 | GM+60 | MG-0.2 | C90 | GM+150 | GM+15 | MG+60 |
| 12.7 | 12.5 | 12.4 | 12.2 | 12.1 | 12 | 12 | 12 | 11.9 | 11.9 |
| B60 | B36 | S7 | S8 | M40t90 | S5 | M0t90 | T1.0H | T0.30H | Sw |
| 9.13 | 9.33 | 9.79 | 10 | 10.1 | 10.1 | 10.1 | 10.1 | 10.1 | 10.1 |