| Start Page |
|
 |
| Start Page |
|
|
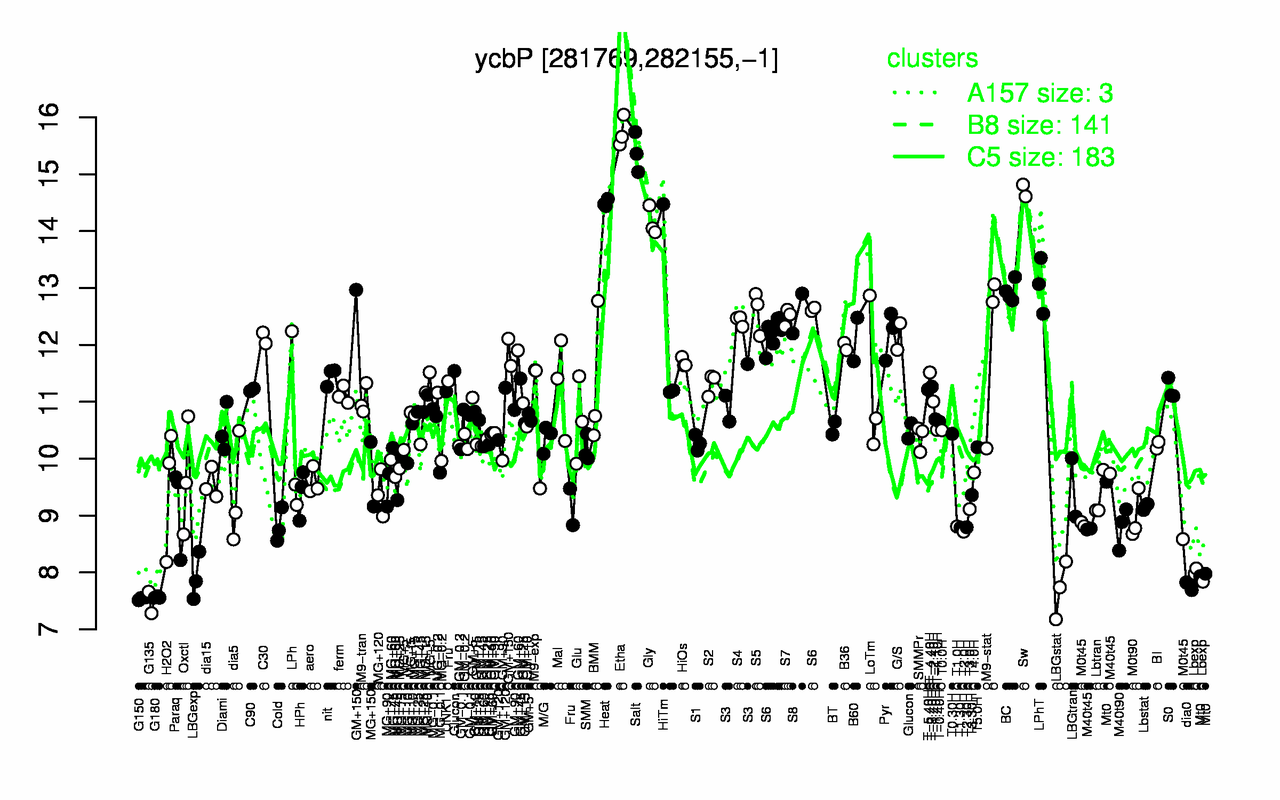
| Etha | Salt | Sw | Heat | Gly | LPhT | BC | S5 | S8 | S7 |
| 15.7 | 15.4 | 14.7 | 14.5 | 14.2 | 13 | 12.9 | 12.6 | 12.6 | 12.5 |
| G135 | G150 | G180 | LBGstat | dia0 | LBGexp | Lbexp | Mt0 | T2.0H | M0t45 |
| 7.47 | 7.54 | 7.57 | 7.7 | 7.77 | 7.91 | 7.96 | 8.5 | 8.72 | 8.76 |