| Start Page |
|
 |
| Start Page |
|
|
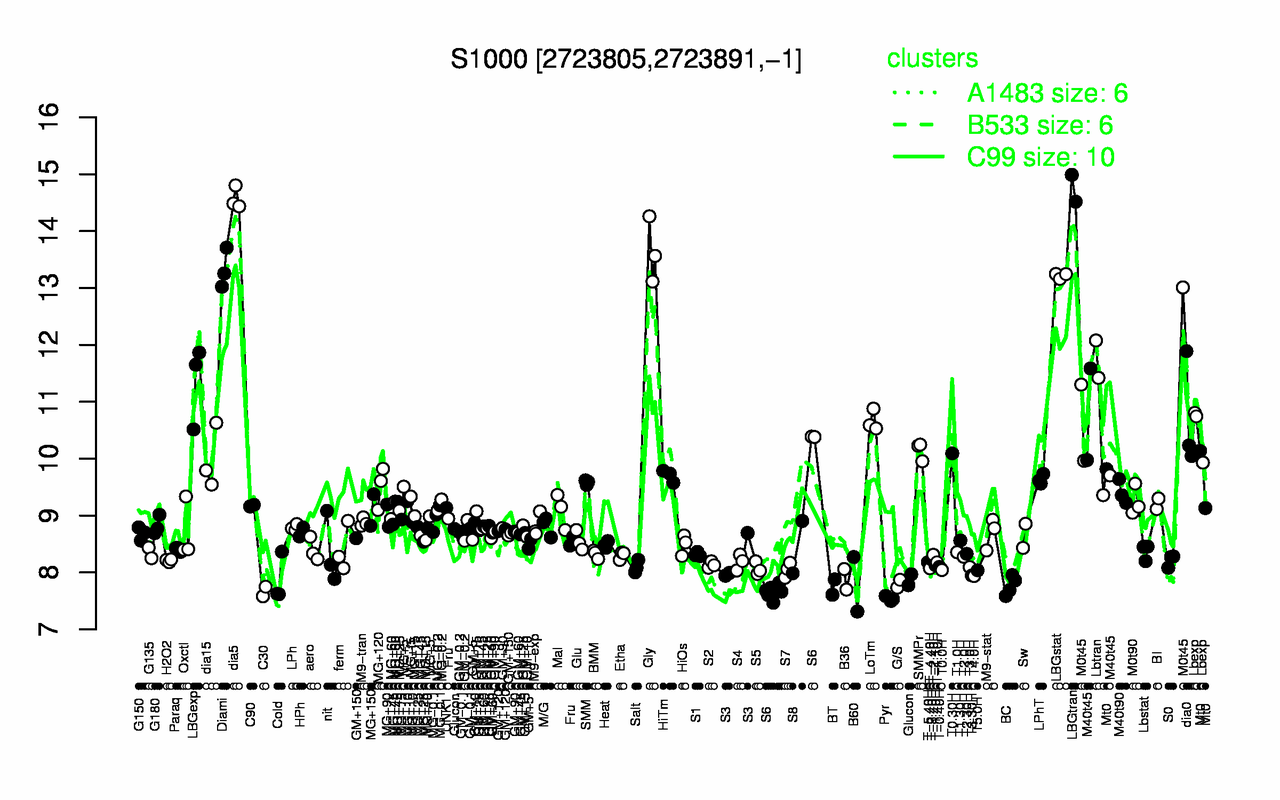
| LBGtran | dia5 | Gly | Diami | LBGstat | M0t45 | LBGexp | Lbtran | dia0 | LoTm |
| 14.8 | 14.6 | 13.6 | 13.3 | 13.2 | 11.4 | 11.3 | 11 | 10.7 | 10.7 |
| Pyr | C30 | BT | BC | B60 | G/S | Cold | B36 | T4.0H | T3.30H |
| 7.54 | 7.67 | 7.74 | 7.77 | 7.79 | 7.8 | 7.87 | 7.88 | 7.94 | 7.95 |