| Start Page |
|
 |
| Start Page |
|
|
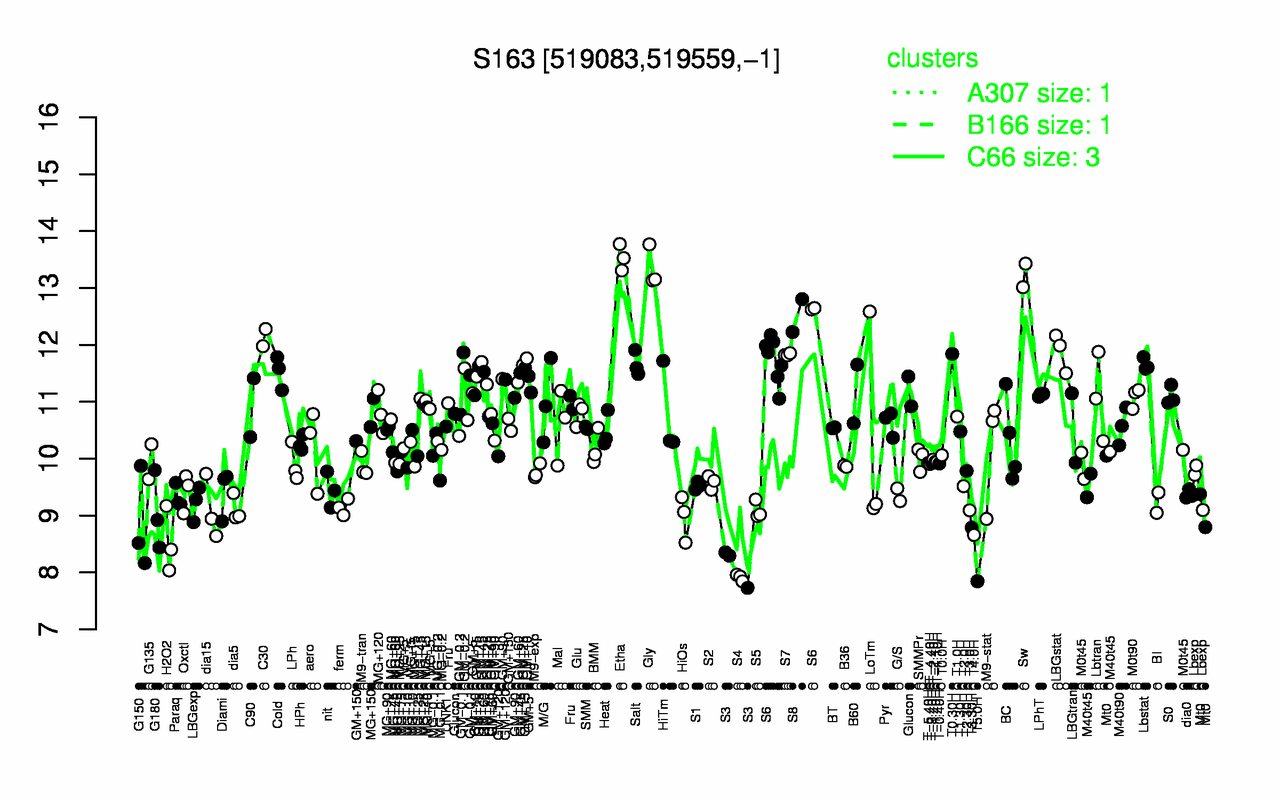
| Etha | Gly | Sw | S8 | C30 | S6 | LBGstat | T0.30H | S7 | Salt |
| 13.5 | 13.4 | 13.2 | 12.5 | 12.1 | 11.9 | 11.9 | 11.8 | 11.8 | 11.7 |
| T5.0H | S4 | S3 | H2O2 | T4.0H | T3.30H | G150 | HiOs | G180 | T3.0H |
| 7.85 | 7.91 | 8.13 | 8.54 | 8.66 | 8.79 | 8.85 | 8.97 | 9.05 | 9.09 |