B. subtilis Expression Data Browser
Details about S1022 Show/Hide
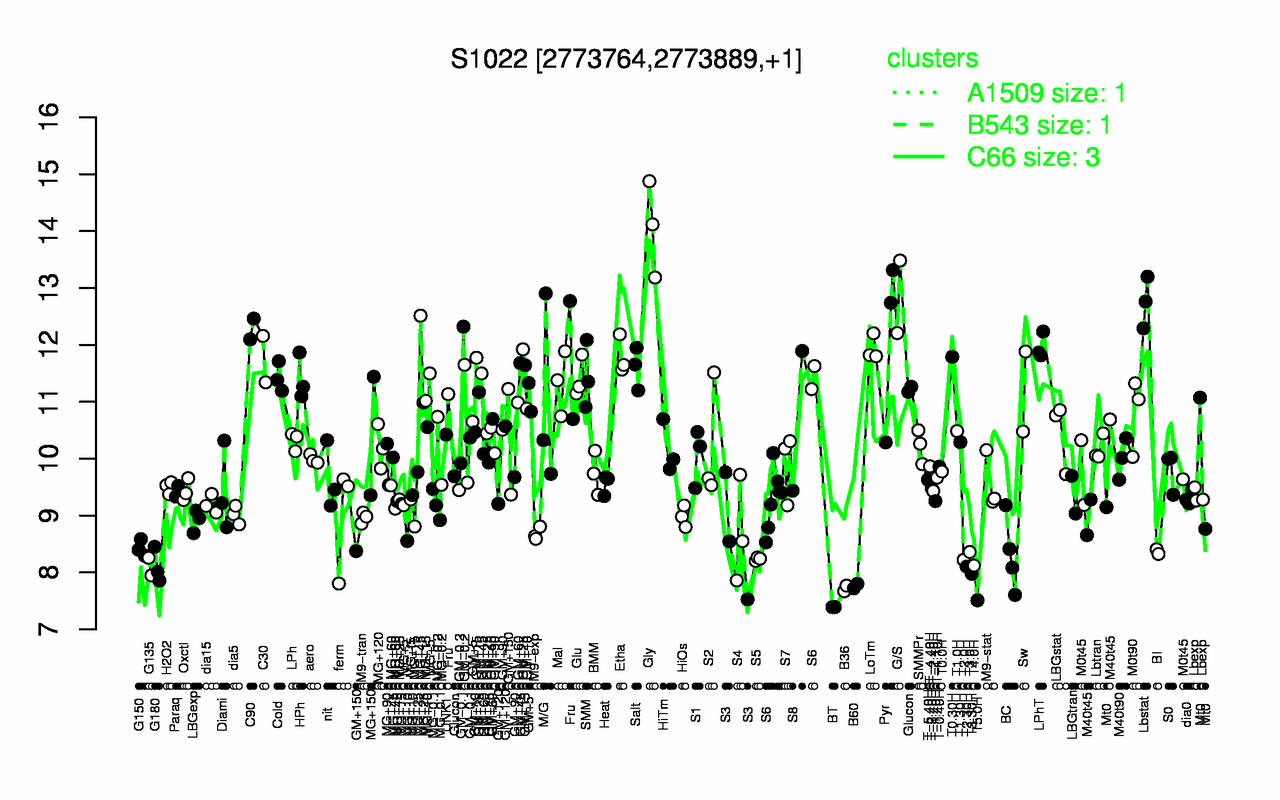
Highest Expression Conditions
Gly G/S Lbstat C90 Pyr LPhT LoTm Etha T0.30H C30
14.1 12.8 12.7 12.3 12.1 12 11.9 11.8 11.8 11.7
Lowest Expression Conditions
BT T5.0H B36 B60 T3.30H G135 G180 T2.30H T4.0H T2.0H
7.39 7.51 7.72 7.76 7.98 8.1 8.11 8.11 8.12 8.22
Most Positively Correlated Segments
yjfB S163 cheV mcpC yomK yjbJ yscB S1497 yvzG mcpB
0.65 0.6 0.58 0.57 0.57 0.57 0.57 0.55 0.54 0.54
Most Negatively Correlated Segments
dtpT ywqK ycnK ywqJ S1216 catD catE ydfJ hemZ spoIIE
-0.4 -0.39 -0.38 -0.36 -0.36 -0.35 -0.35 -0.34 -0.34 -0.34
Expression Profile of Segment S1022 Show/Hide
Genomic View of Gene/Segment S1022 Show/Hide
(Legend)