B. subtilis Expression Data Browser
Start Page
B. subtilis Expression Data Browser
Gene/Segment:
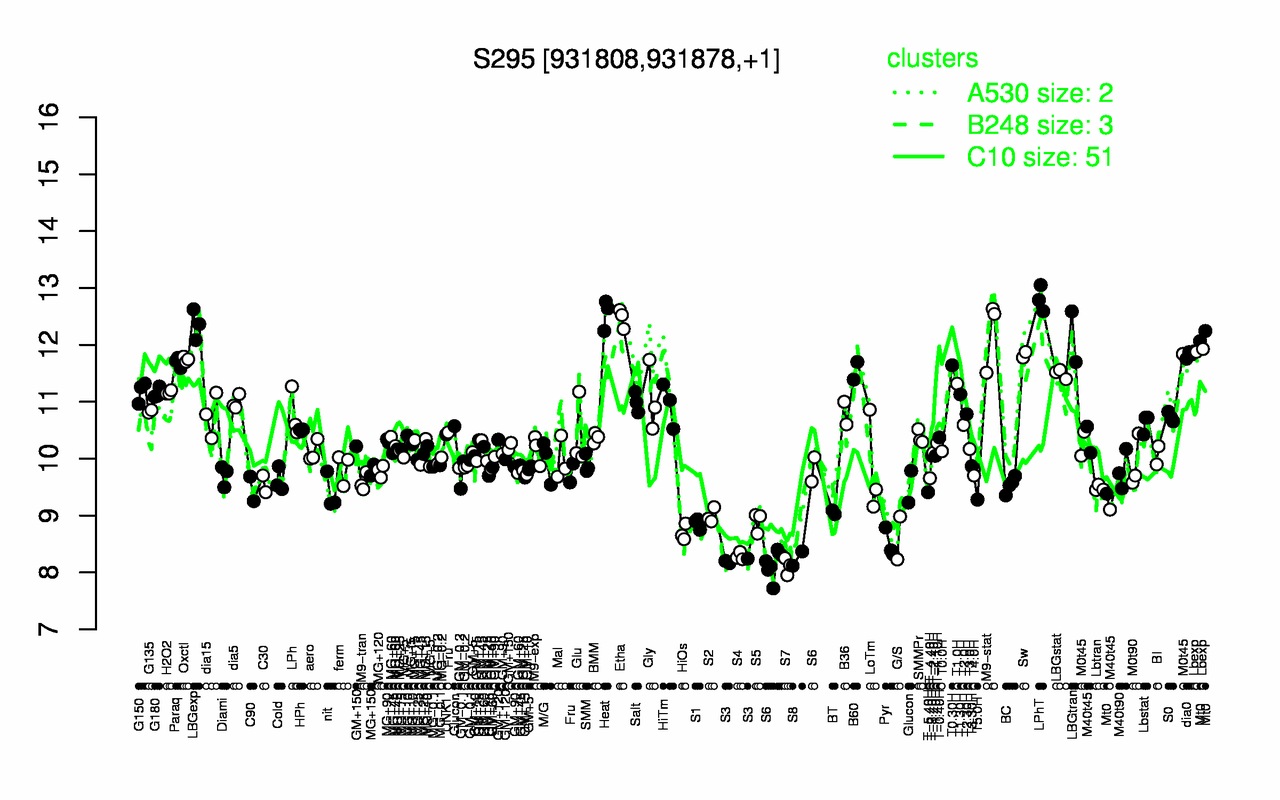
S295
Locus Tag:
new_931808_931878
Details about S295
Show/Hide
Highest Expression Conditions
LPhT
Heat
Etha
LBGexp
M9-stat
LBGtran
Lbexp
Sw
dia0
Oxctl
12.8
12.5
12.5
12.4
12.2
12.1
11.9
11.8
11.8
11.7
Lowest Expression Conditions
S7
S3
S8
S4
Pyr
S6
G/S
HiOs
S1
S5
8.11
8.2
8.24
8.28
8.5
8.53
8.61
8.7
8.86
8.89
Most Positively Correlated Segments
csbB
yfhO
S294
menE
menC
ykuT
S755
yodJ
ypuA
S450
0.91
0.84
0.77
0.75
0.73
0.73
0.71
0.71
0.7
0.69
Most Negatively Correlated Segments
sspL
S1150
sodC
S1289
yjbA
S832
S925
S1451
yqzE
rapF
-0.68
-0.64
-0.63
-0.63
-0.63
-0.63
-0.62
-0.61
-0.6
-0.59
Expression Profile of Segment S295
Show/Hide
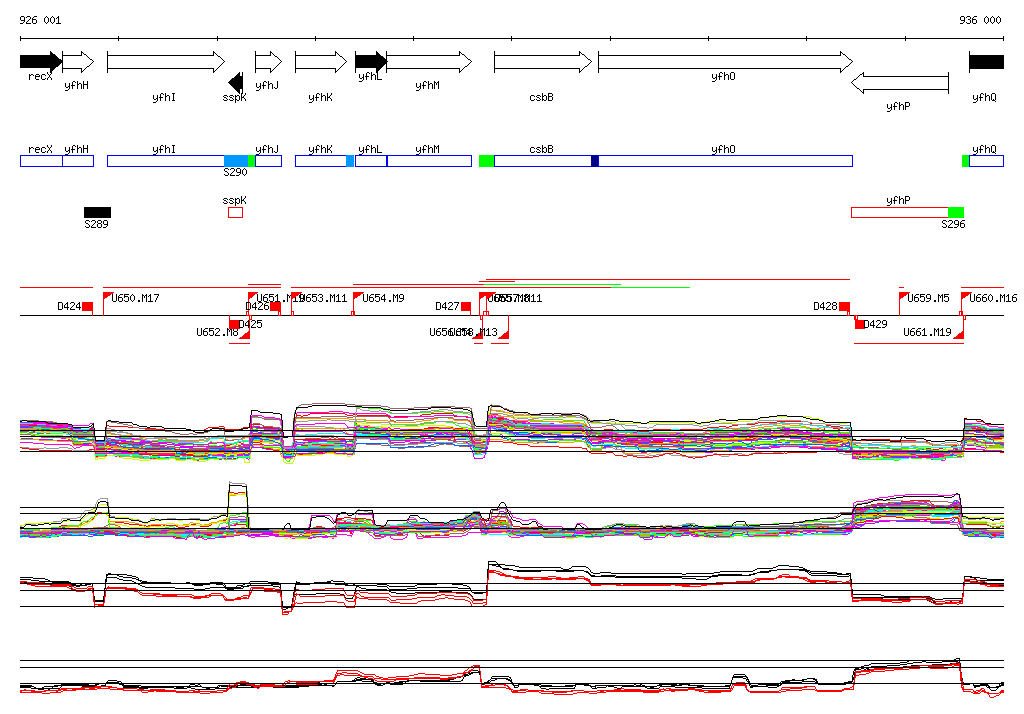
Genomic View of Gene/Segment S295
Show/Hide
(Legend)
Browse Genome Context