B. subtilis Expression Data Browser
Details about NA Show/Hide
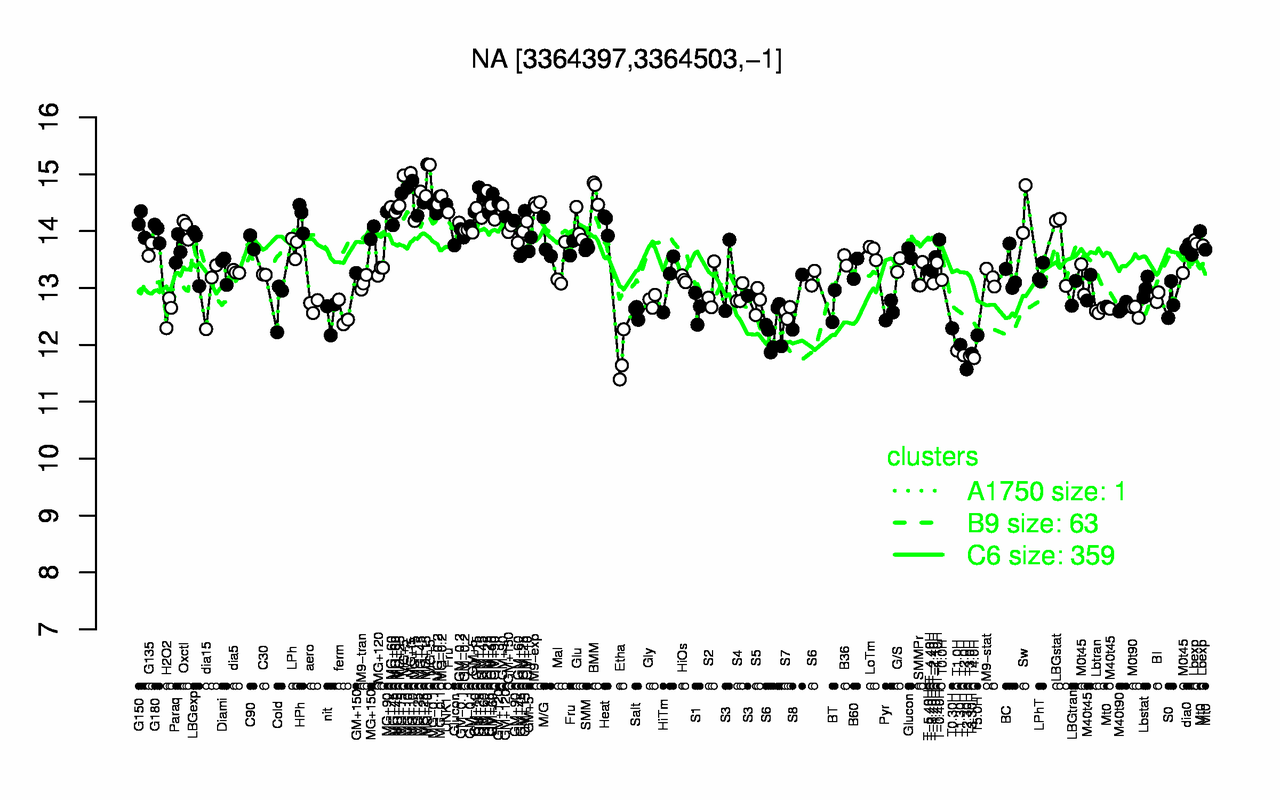
Highest Expression Conditions
MG+5 MG+t5 MG+10 BMM MG-0.2 GM+25 MG+15 M9-exp UNK1 MG-0.1
15.1 15 14.9 14.7 14.5 14.5 14.5 14.5 14.5 14.5
Lowest Expression Conditions
T2.30H T4.0H Etha T3.0H T2.0H T3.30H T1.0H T1.30H T5.0H T0.30H
11.6 11.8 11.8 11.8 11.8 11.8 11.9 12 12.2 12.3
Most Positively Correlated Segments
S1261 metQ metP metN S231 NA purE yocC S1434 NA
0.86 0.8 0.76 0.76 0.69 0.69 0.67 0.67 0.67 0.67
Most Negatively Correlated Segments
ypiB ypiF S609 ykuV S744 iseA S346 S608 S948 S345
-0.67 -0.66 -0.63 -0.61 -0.61 -0.61 -0.61 -0.6 -0.6 -0.6
Expression Profile of Segment NA Show/Hide
Genomic View of Gene/Segment NA Show/Hide
(Legend)