| Start Page |
|
 |
| Start Page |
|
|
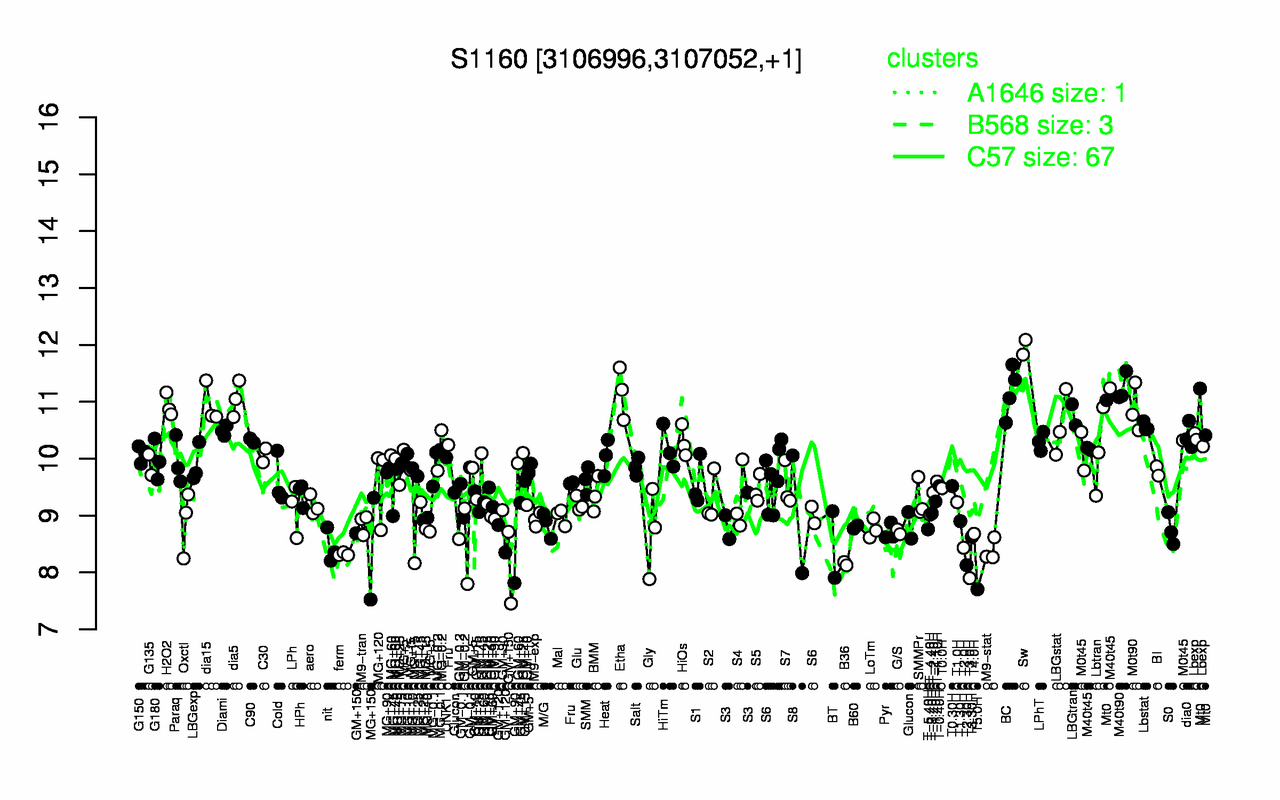
| Sw | M40t90 | BC | Etha | dia5 | dia15 | H2O2 | Mt0 | M0t90 | LBGtran |
| 12 | 11.2 | 11.2 | 11.2 | 11.1 | 11 | 10.9 | 10.9 | 10.9 | 10.8 |
| T5.0H | T3.0H | T2.30H | B36 | GM+150 | ferm | M9-stat | MG+150 | T2.0H | nit |
| 7.7 | 7.9 | 8.13 | 8.15 | 8.29 | 8.32 | 8.39 | 8.42 | 8.43 | 8.45 |