| Start Page |
|
 |
| Start Page |
|
|
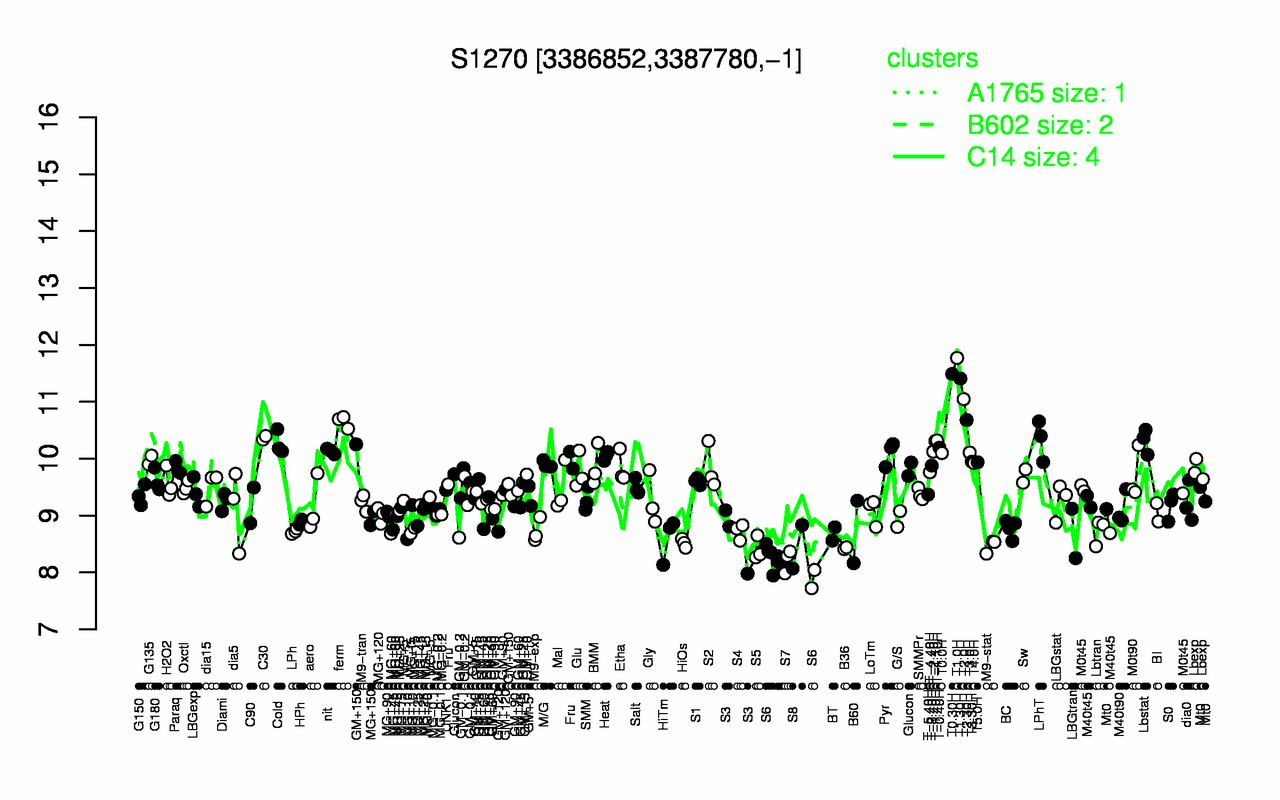
| T1.0H | T0.30H | T1.30H | T2.0H | T2.30H | ferm | C30 | LPhT | T-1.10H | Lbstat |
| 11.8 | 11.5 | 11.4 | 11 | 10.7 | 10.6 | 10.4 | 10.3 | 10.3 | 10.3 |
| S6 | S7 | S5 | B36 | S8 | M9-stat | HiOs | HiTm | S3 | BT |
| 8.17 | 8.21 | 8.41 | 8.43 | 8.45 | 8.47 | 8.52 | 8.59 | 8.63 | 8.68 |