| Start Page |
|
 |
| Start Page |
|
|
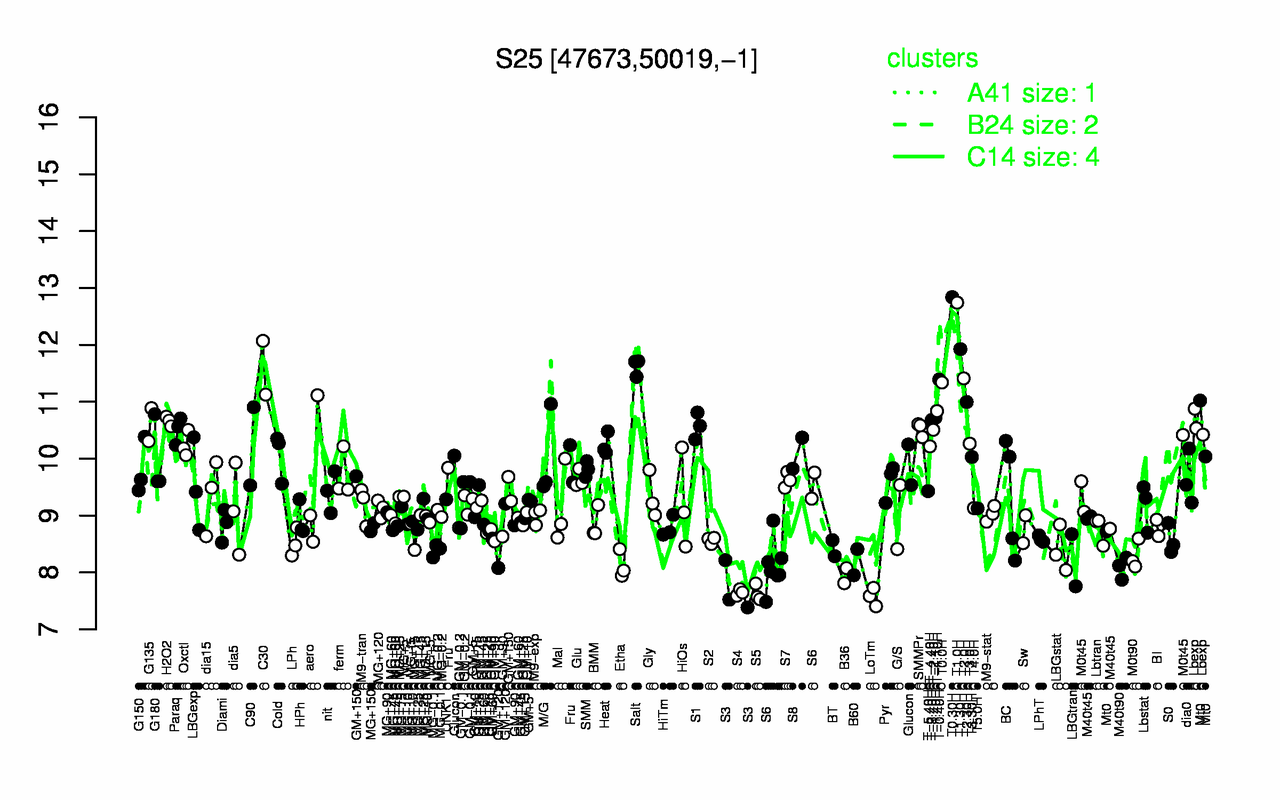
| T0.30H | T1.0H | T1.30H | Salt | C30 | T2.0H | T-0.40H | T0.0H | T2.30H | T-1.10H |
| 12.8 | 12.7 | 11.9 | 11.6 | 11.6 | 11.4 | 11.4 | 11.3 | 11 | 10.8 |
| LoTm | S5 | S4 | S3 | B36 | M40t90 | Etha | B60 | LBGtran | M0t90 |
| 7.57 | 7.63 | 7.65 | 7.71 | 7.94 | 8.08 | 8.13 | 8.18 | 8.21 | 8.3 |