| Start Page |
|
 |
| Start Page |
|
|
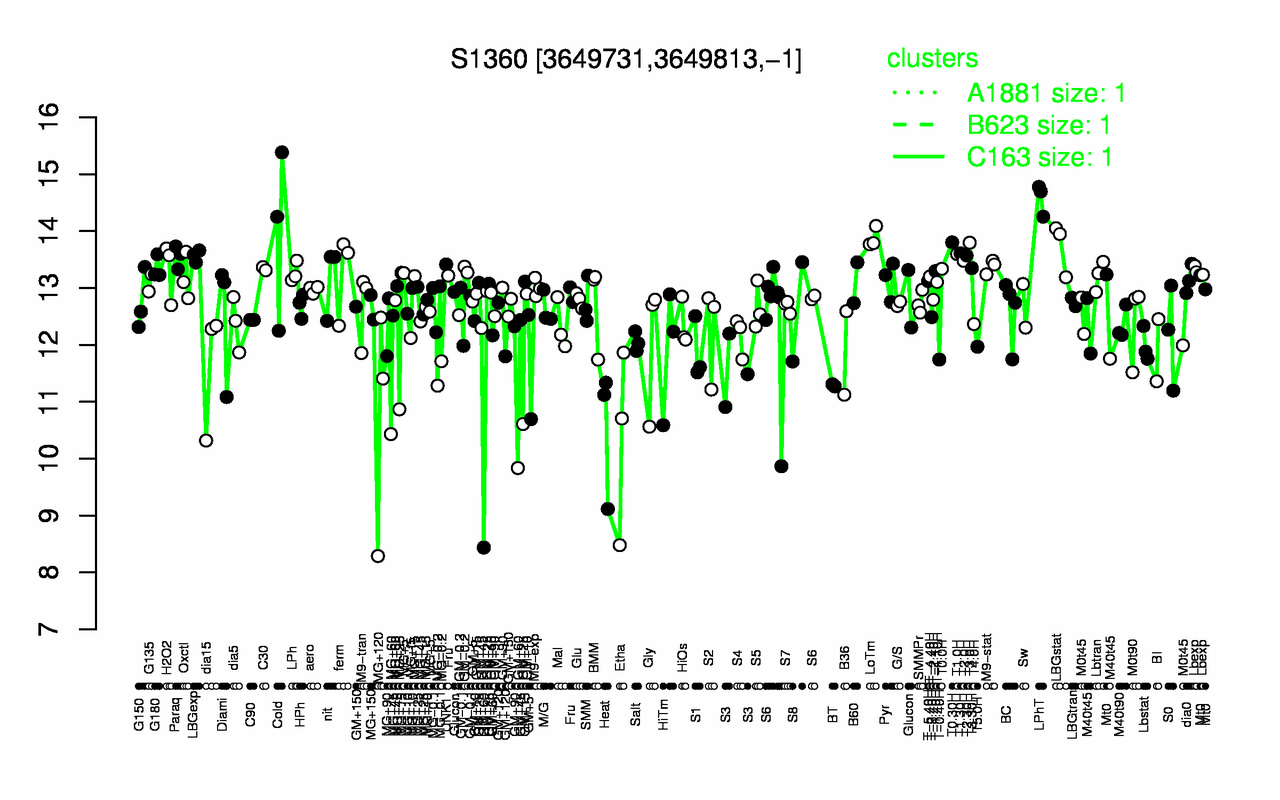
| LPhT | Cold | LoTm | T0.30H | T3.0H | LBGstat | T1.30H | T1.0H | T2.30H | LBGexp |
| 14.6 | 14 | 13.9 | 13.8 | 13.8 | 13.7 | 13.6 | 13.6 | 13.6 | 13.6 |
| GM+60 | Etha | Heat | MG+120 | BT | MG-0.2 | S3 | MG+60 | dia15 | T-0.40H |
| 10.1 | 10.3 | 10.5 | 10.7 | 11.3 | 11.5 | 11.5 | 11.6 | 11.6 | 11.7 |